Mikica Kocic, Fysikum, SU, v4 (2021-04-12)
A performance anomaly was observed while testing a dual socket AMD 7H12 in Dell R6525.
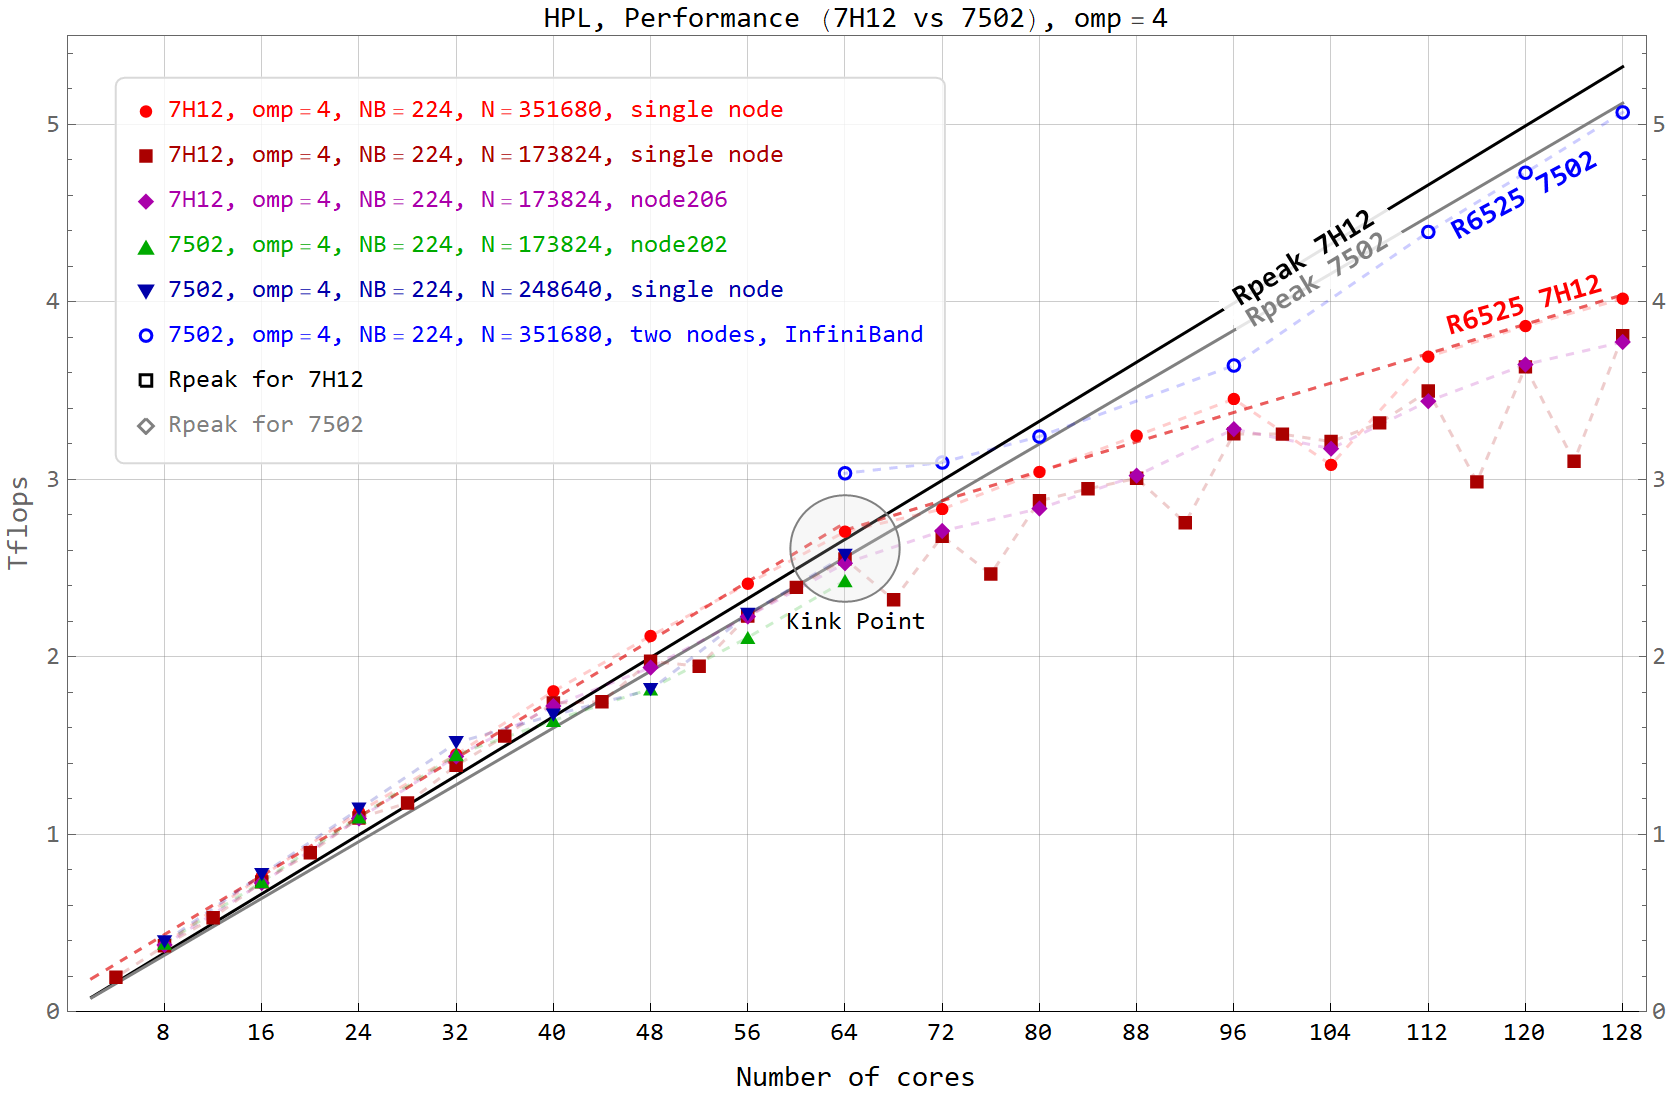
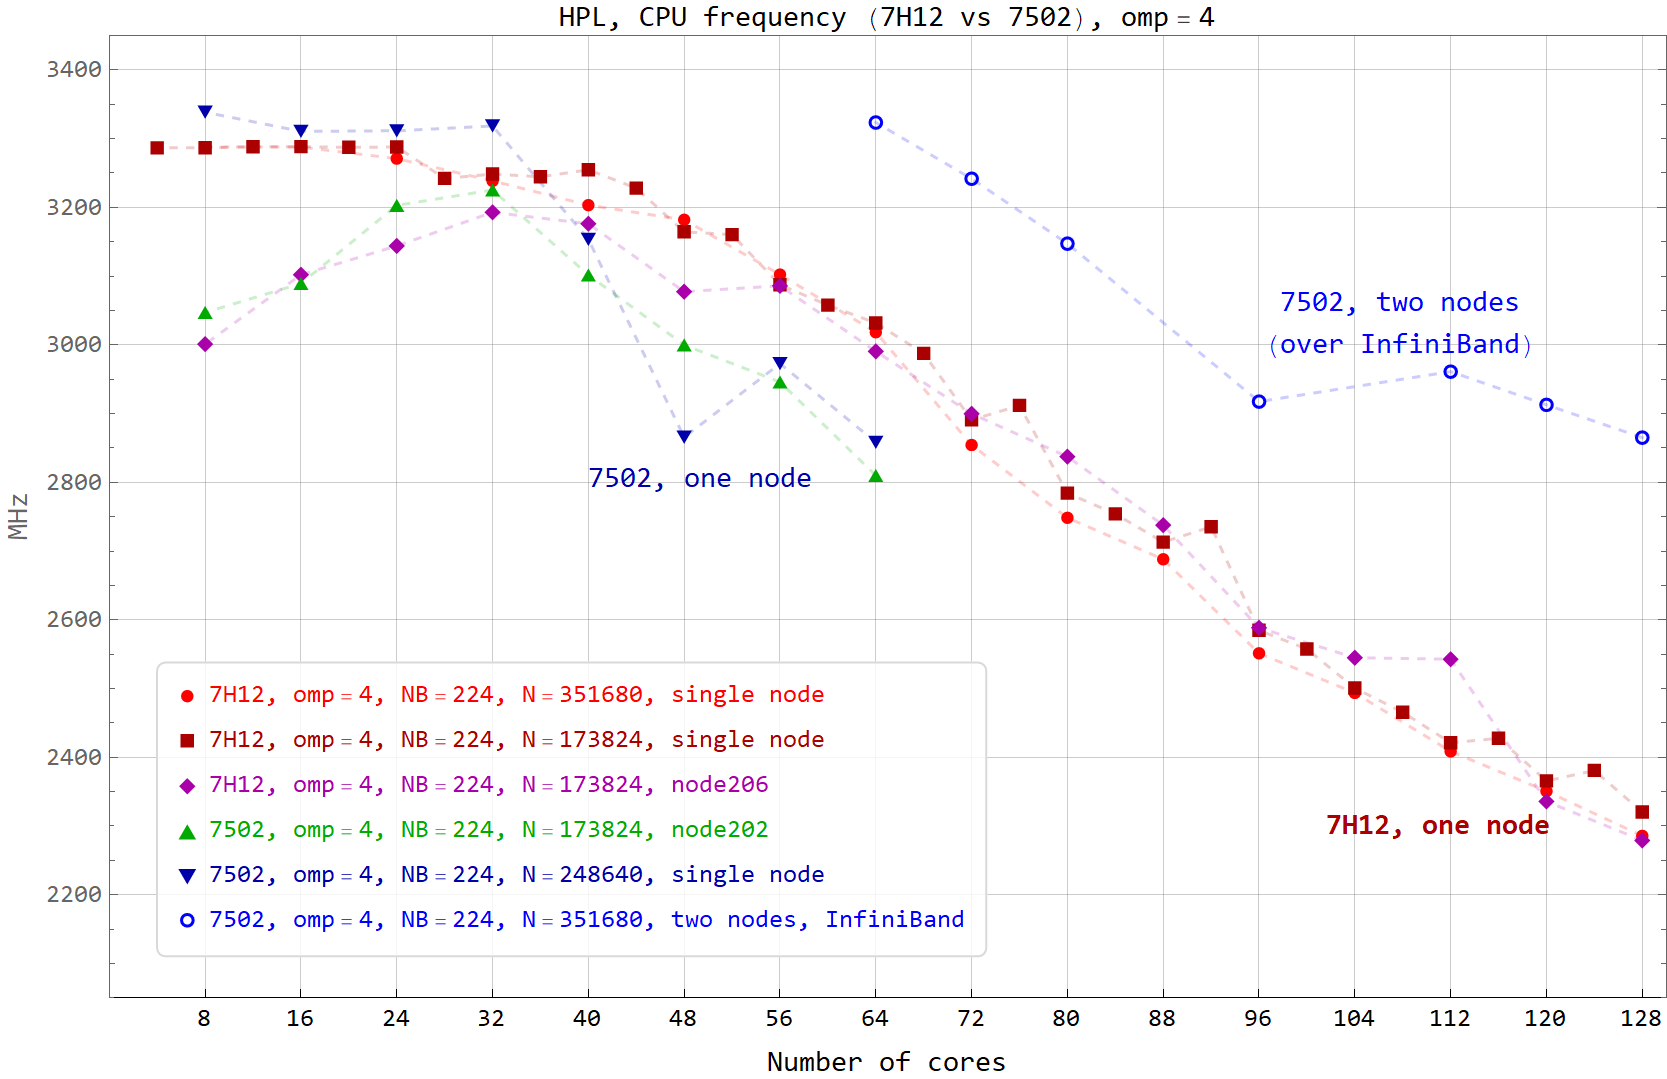
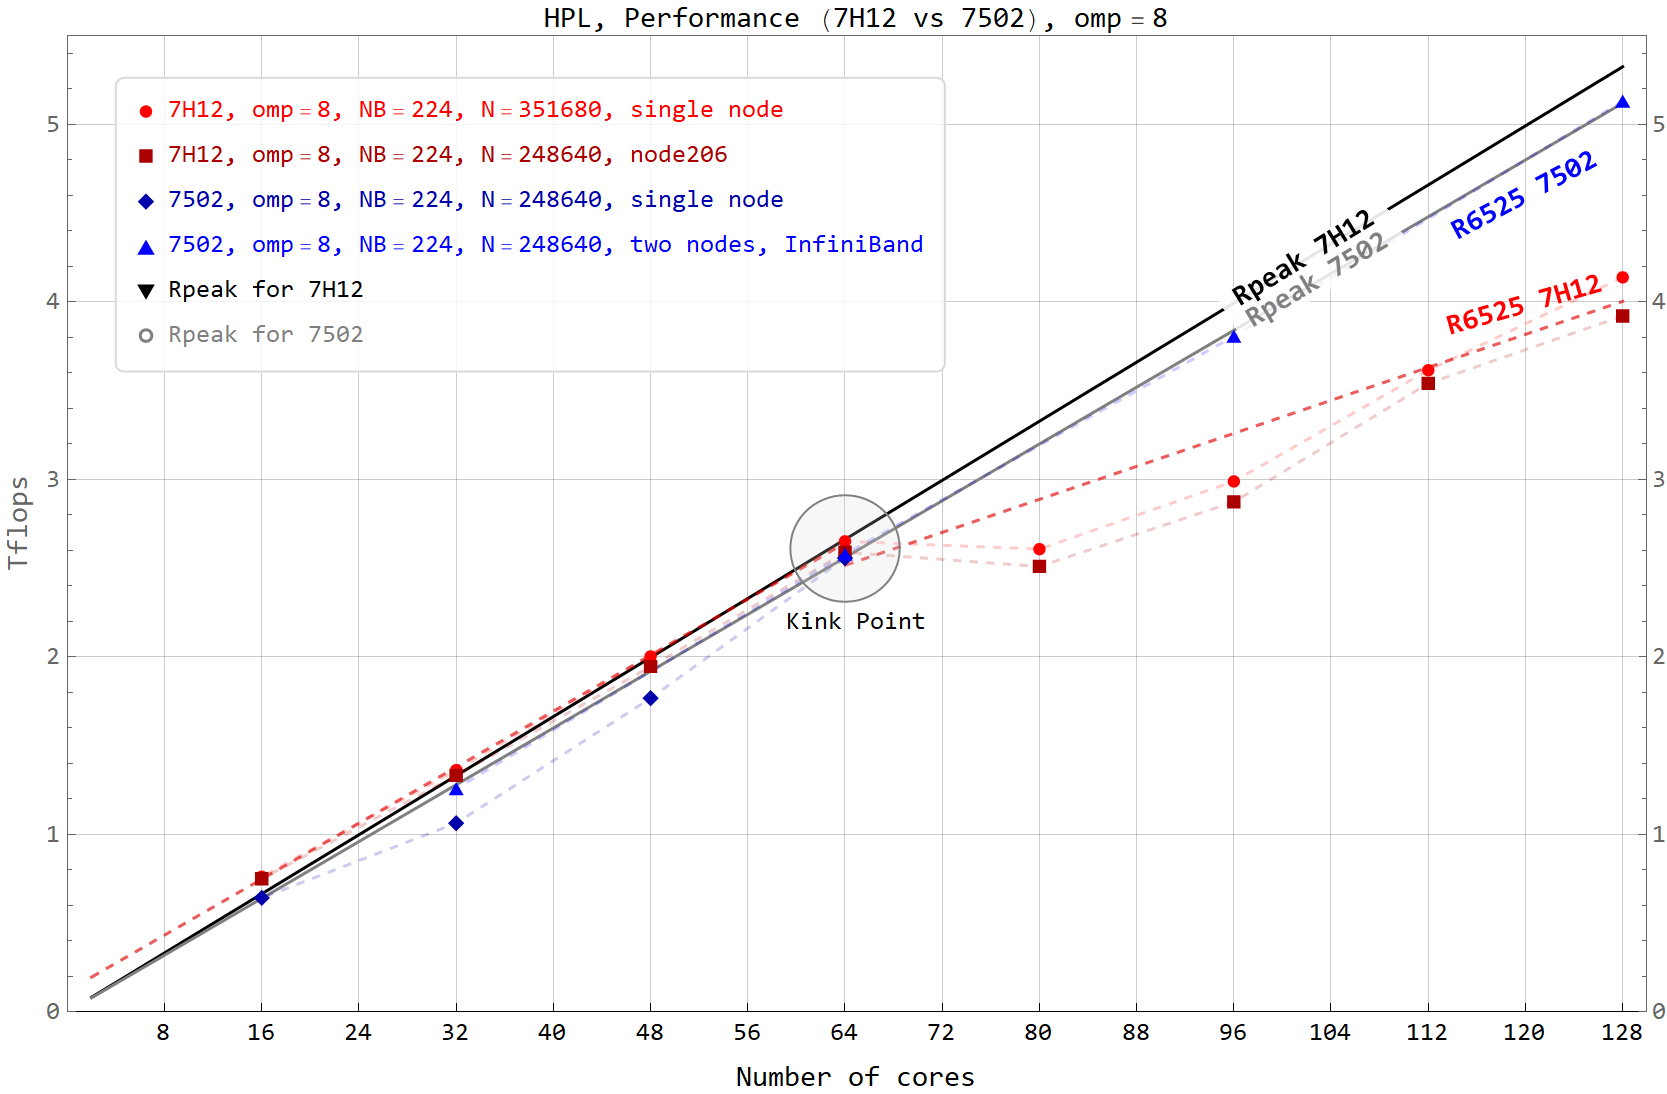
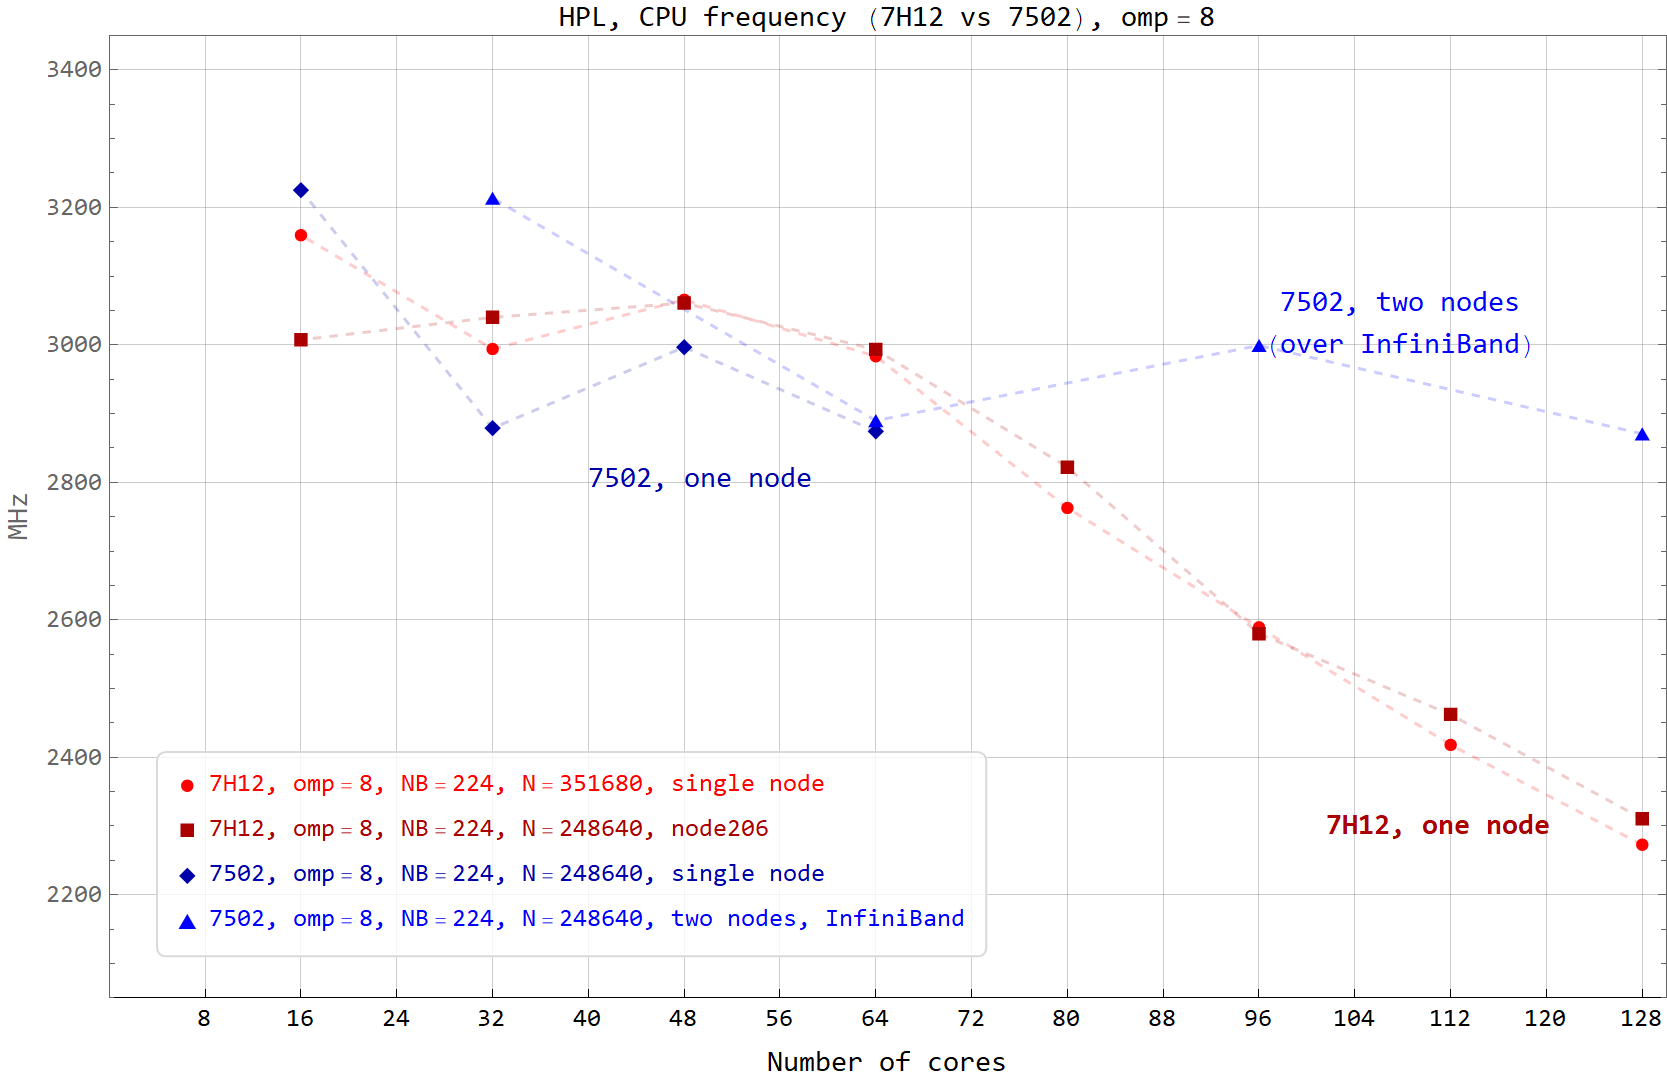
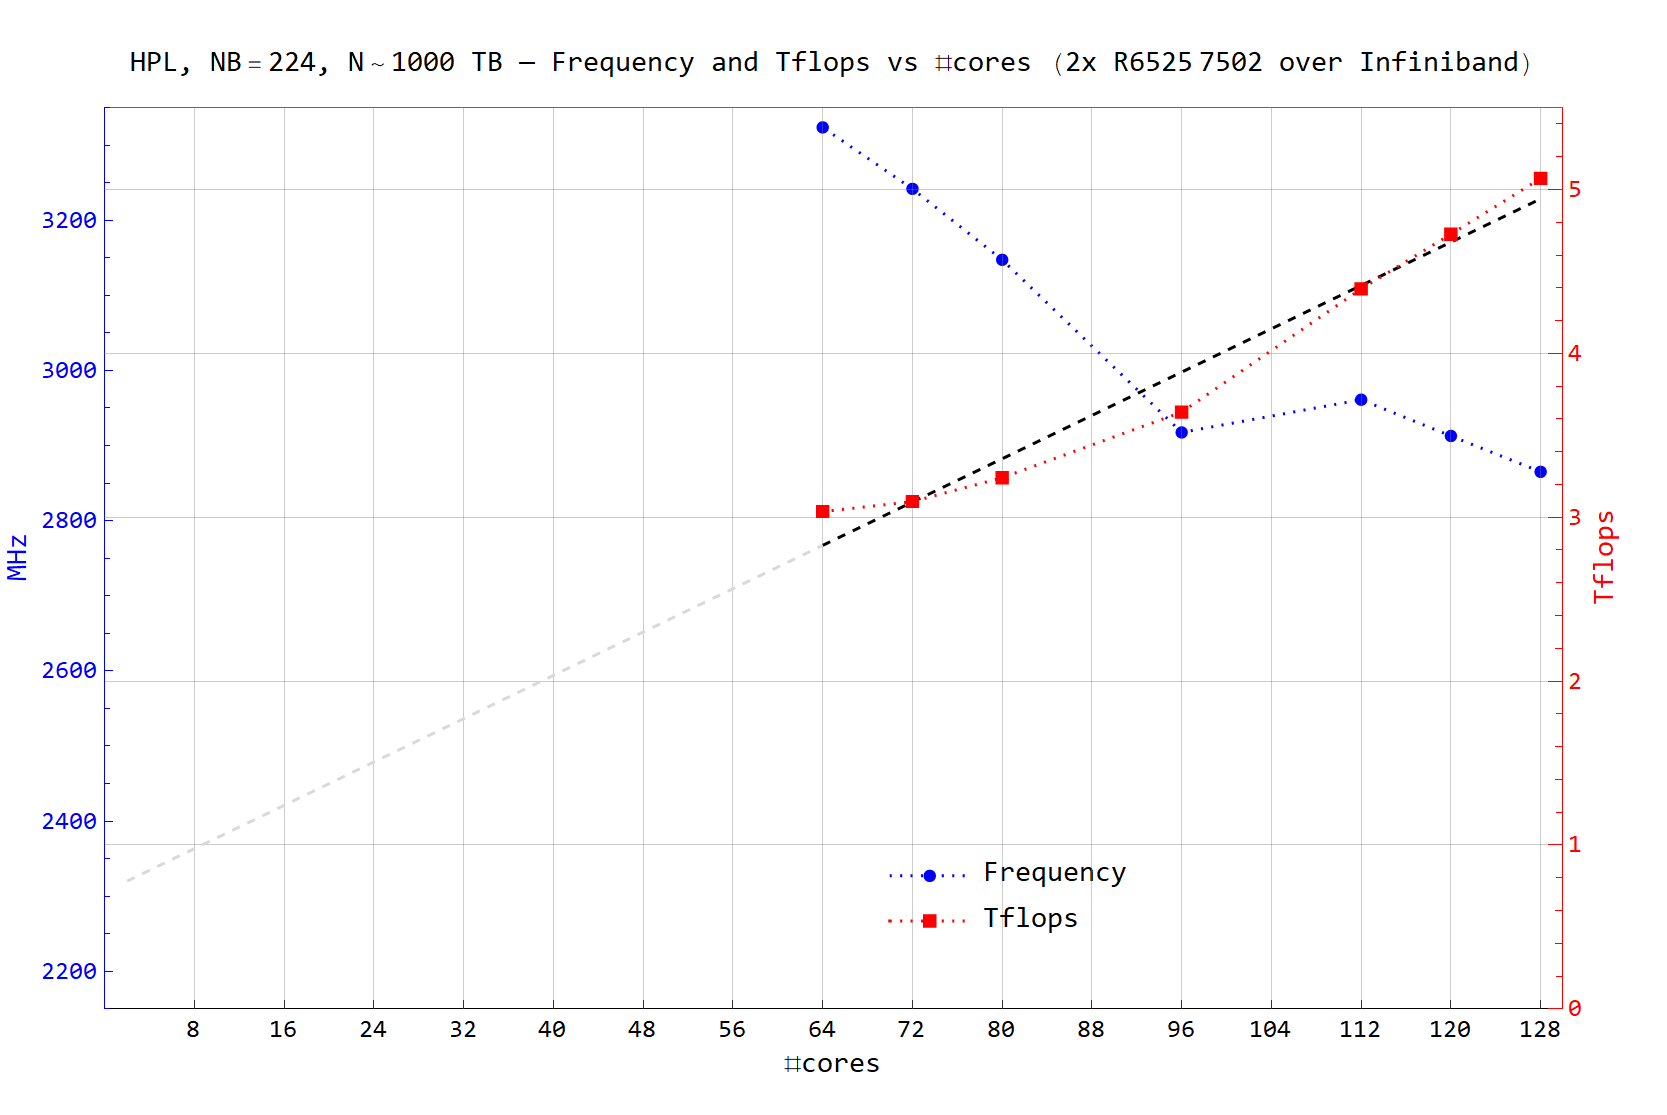
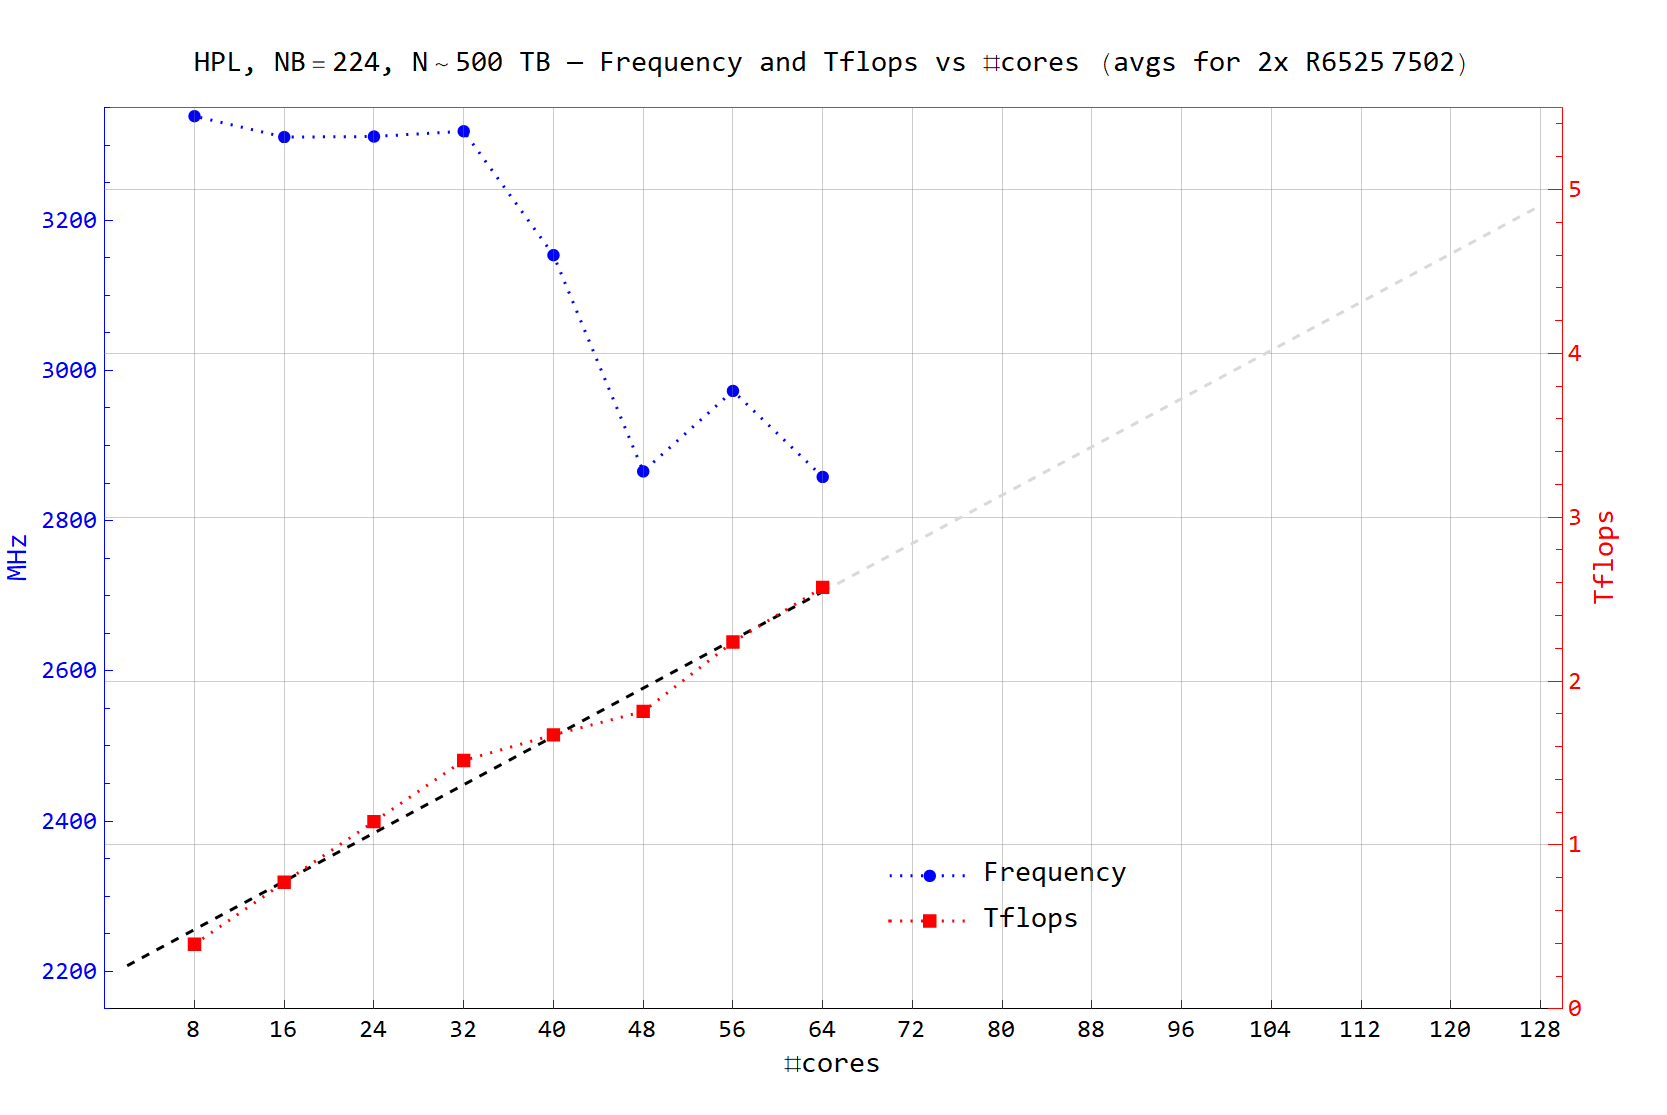
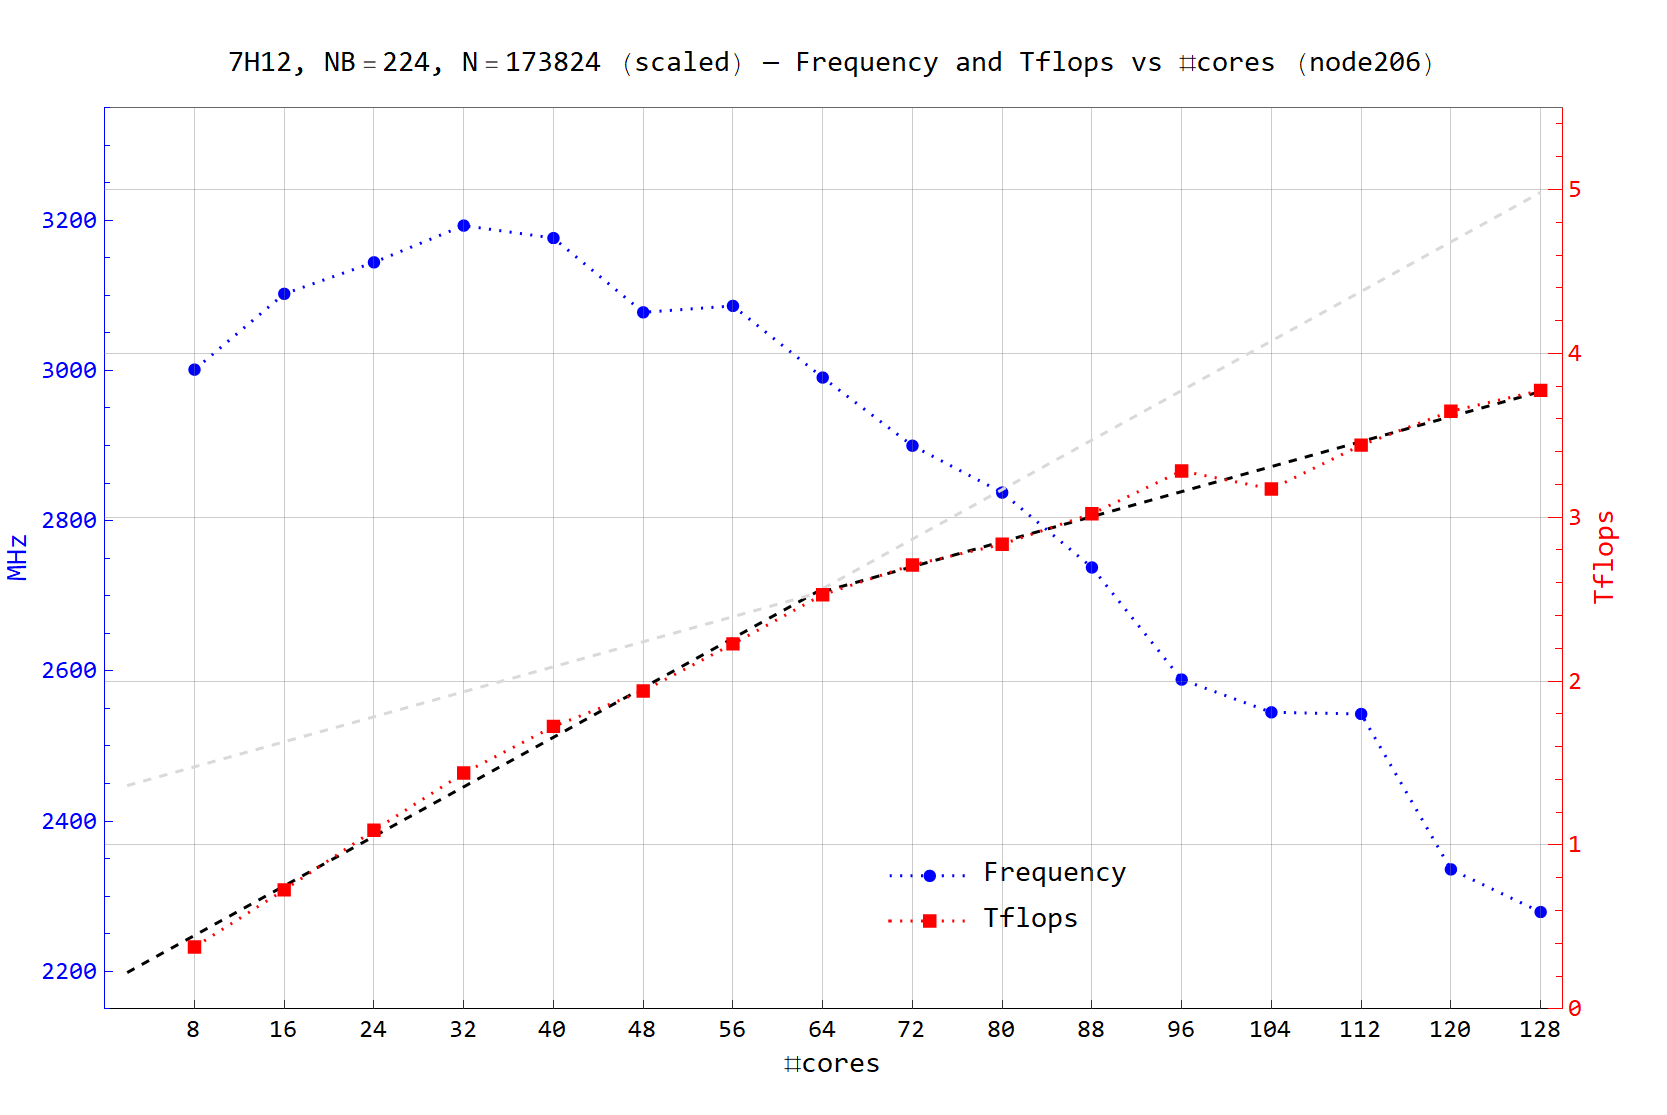
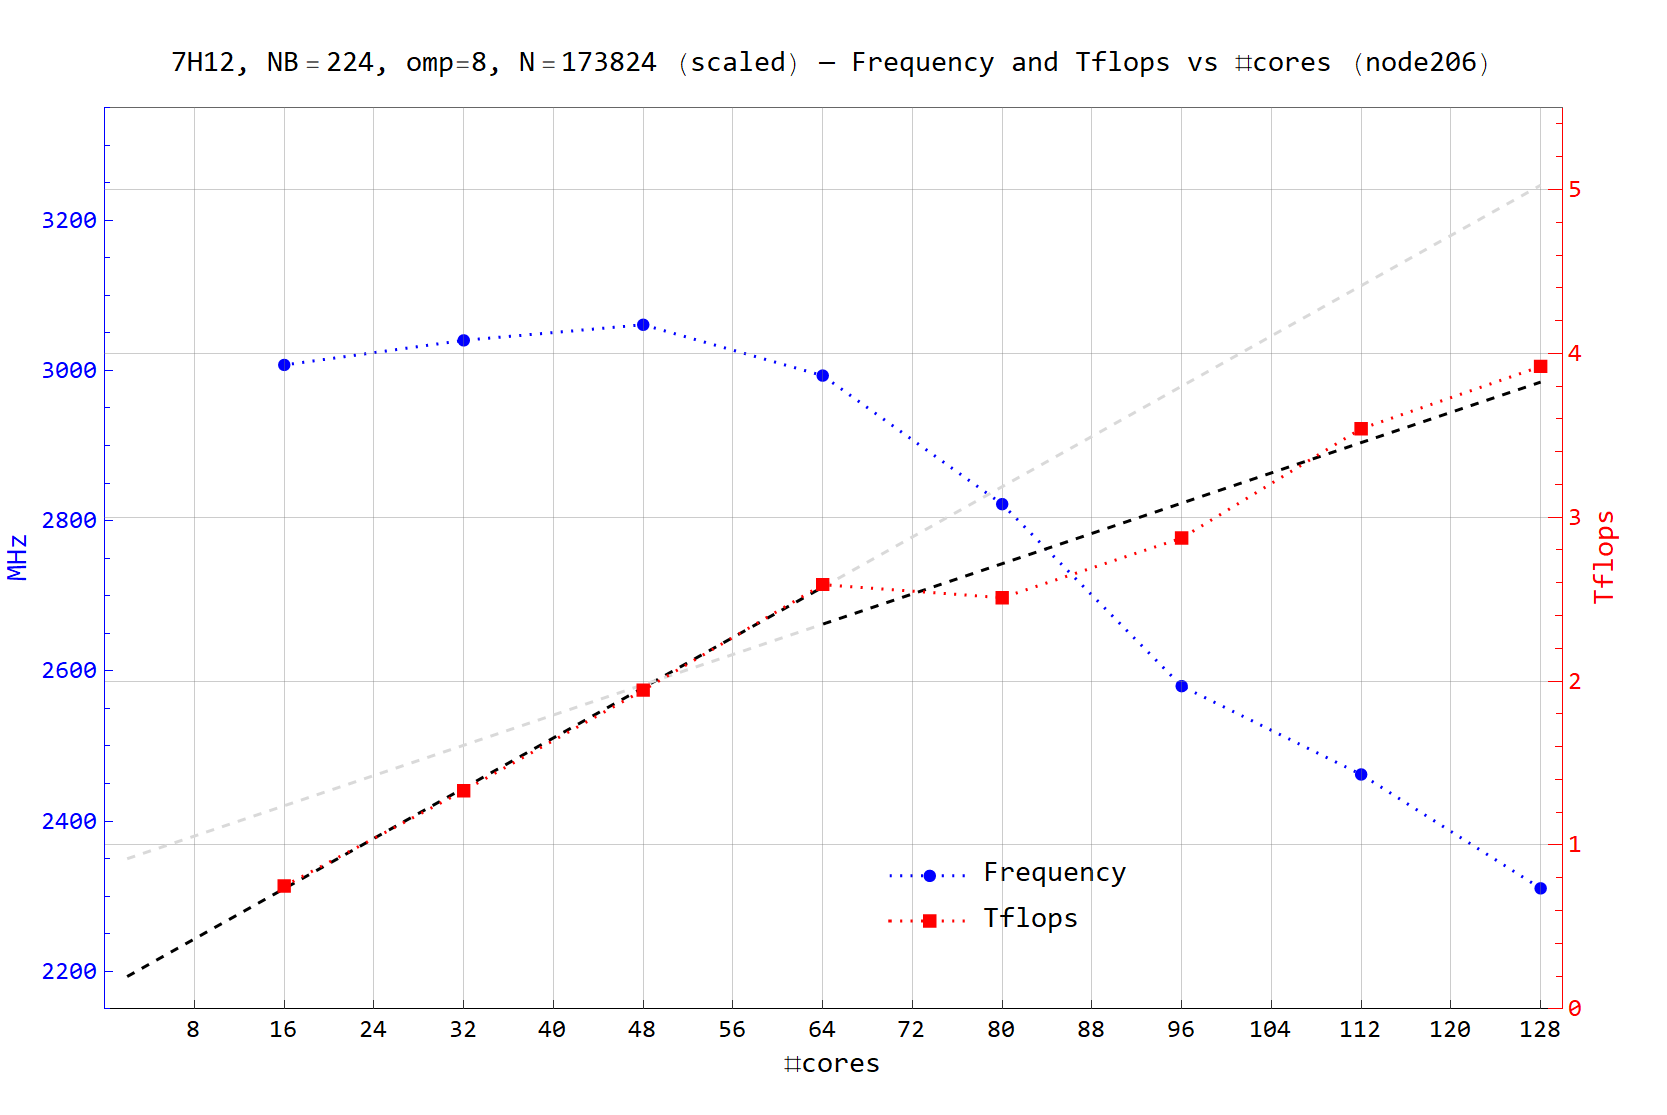
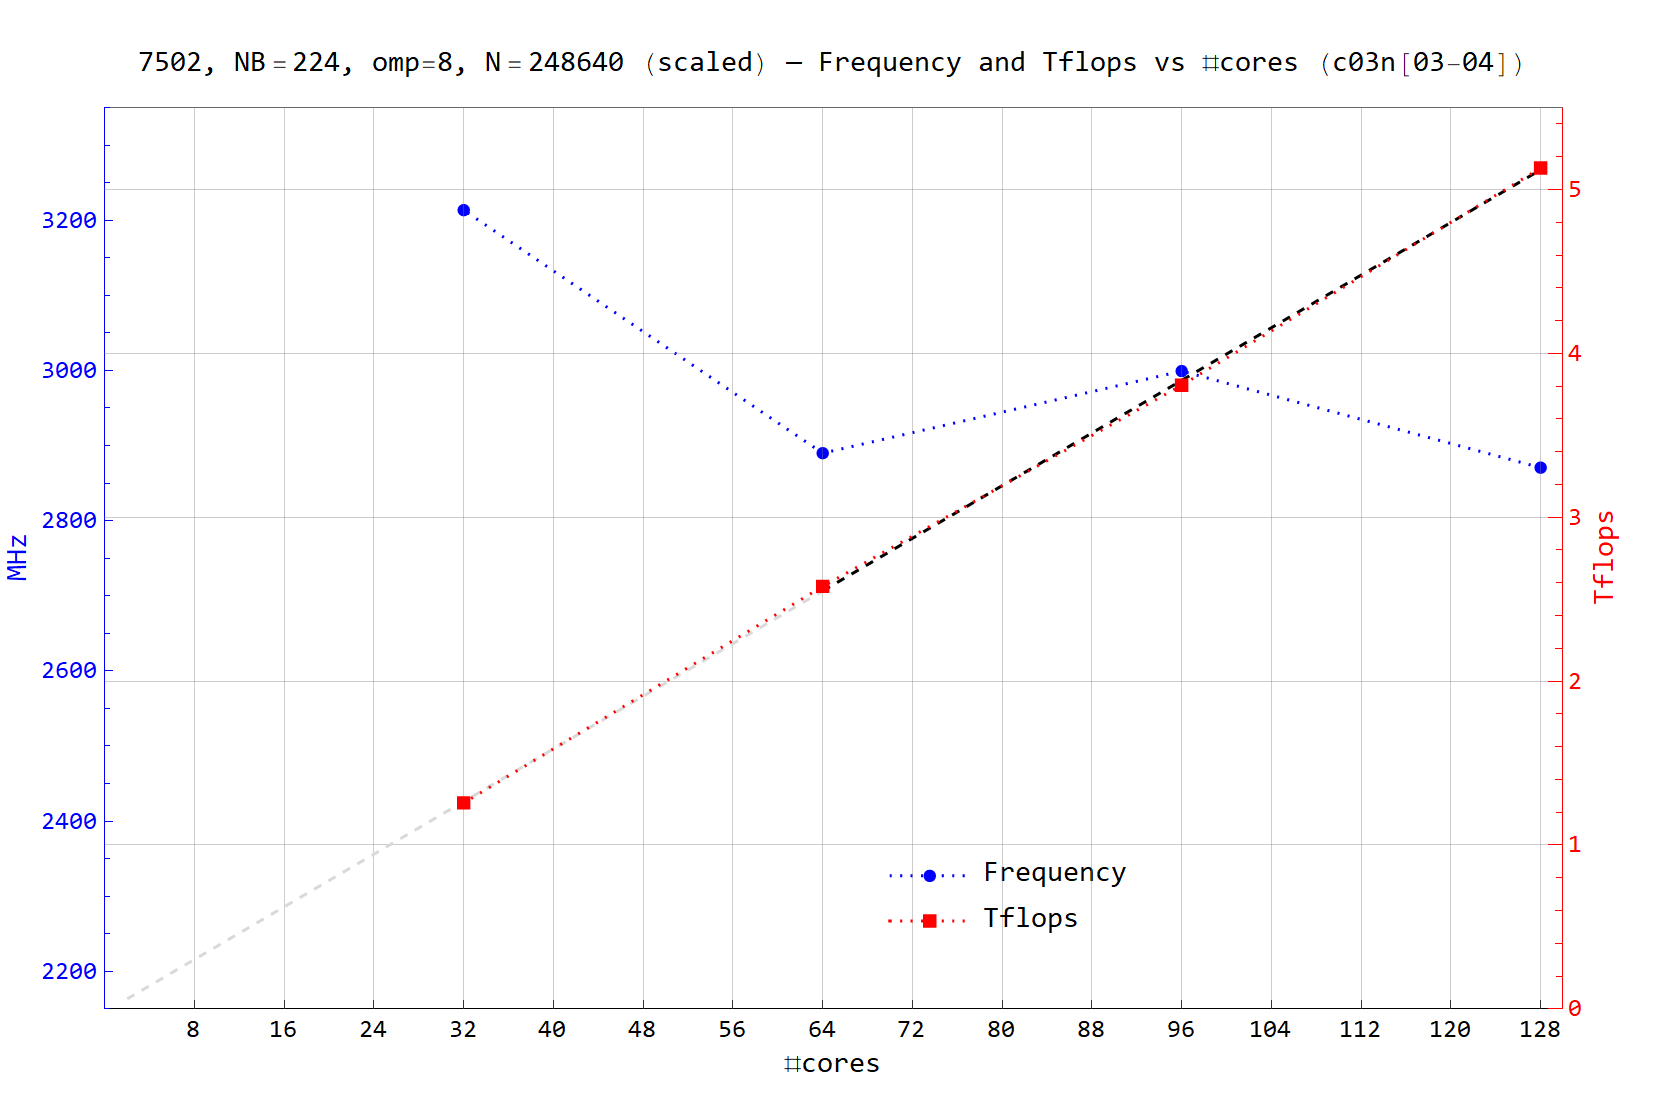
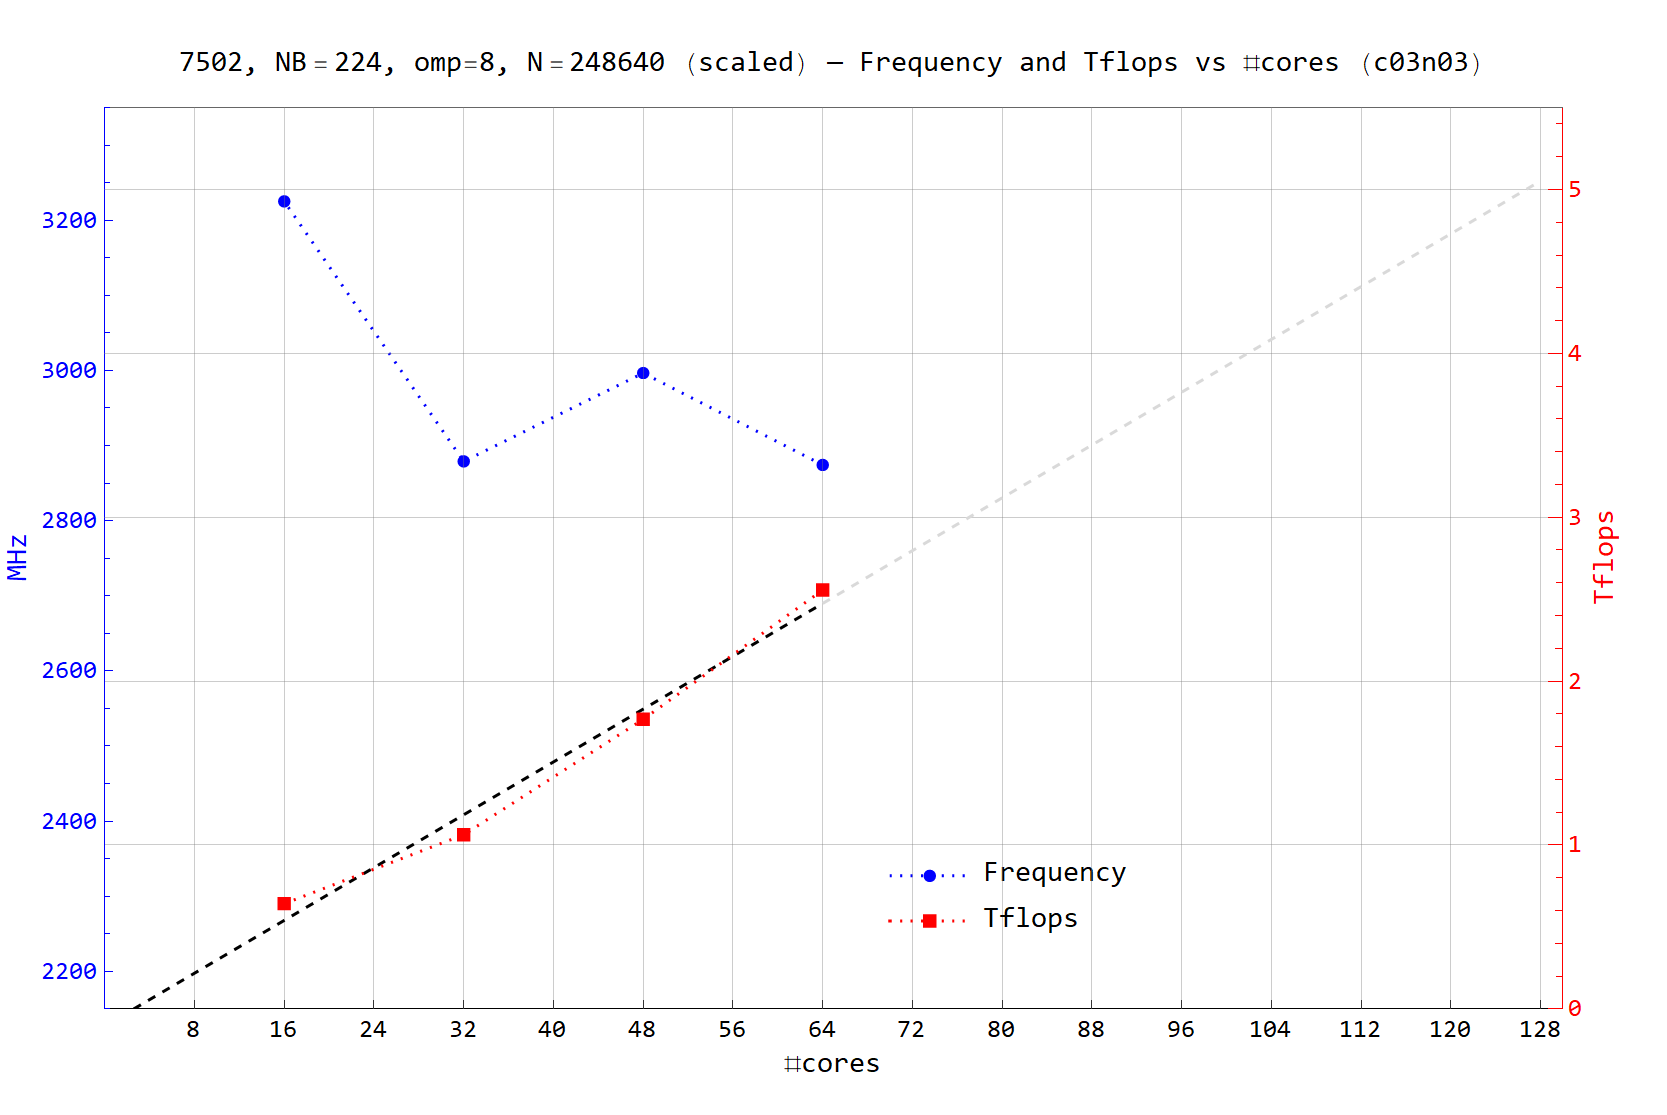
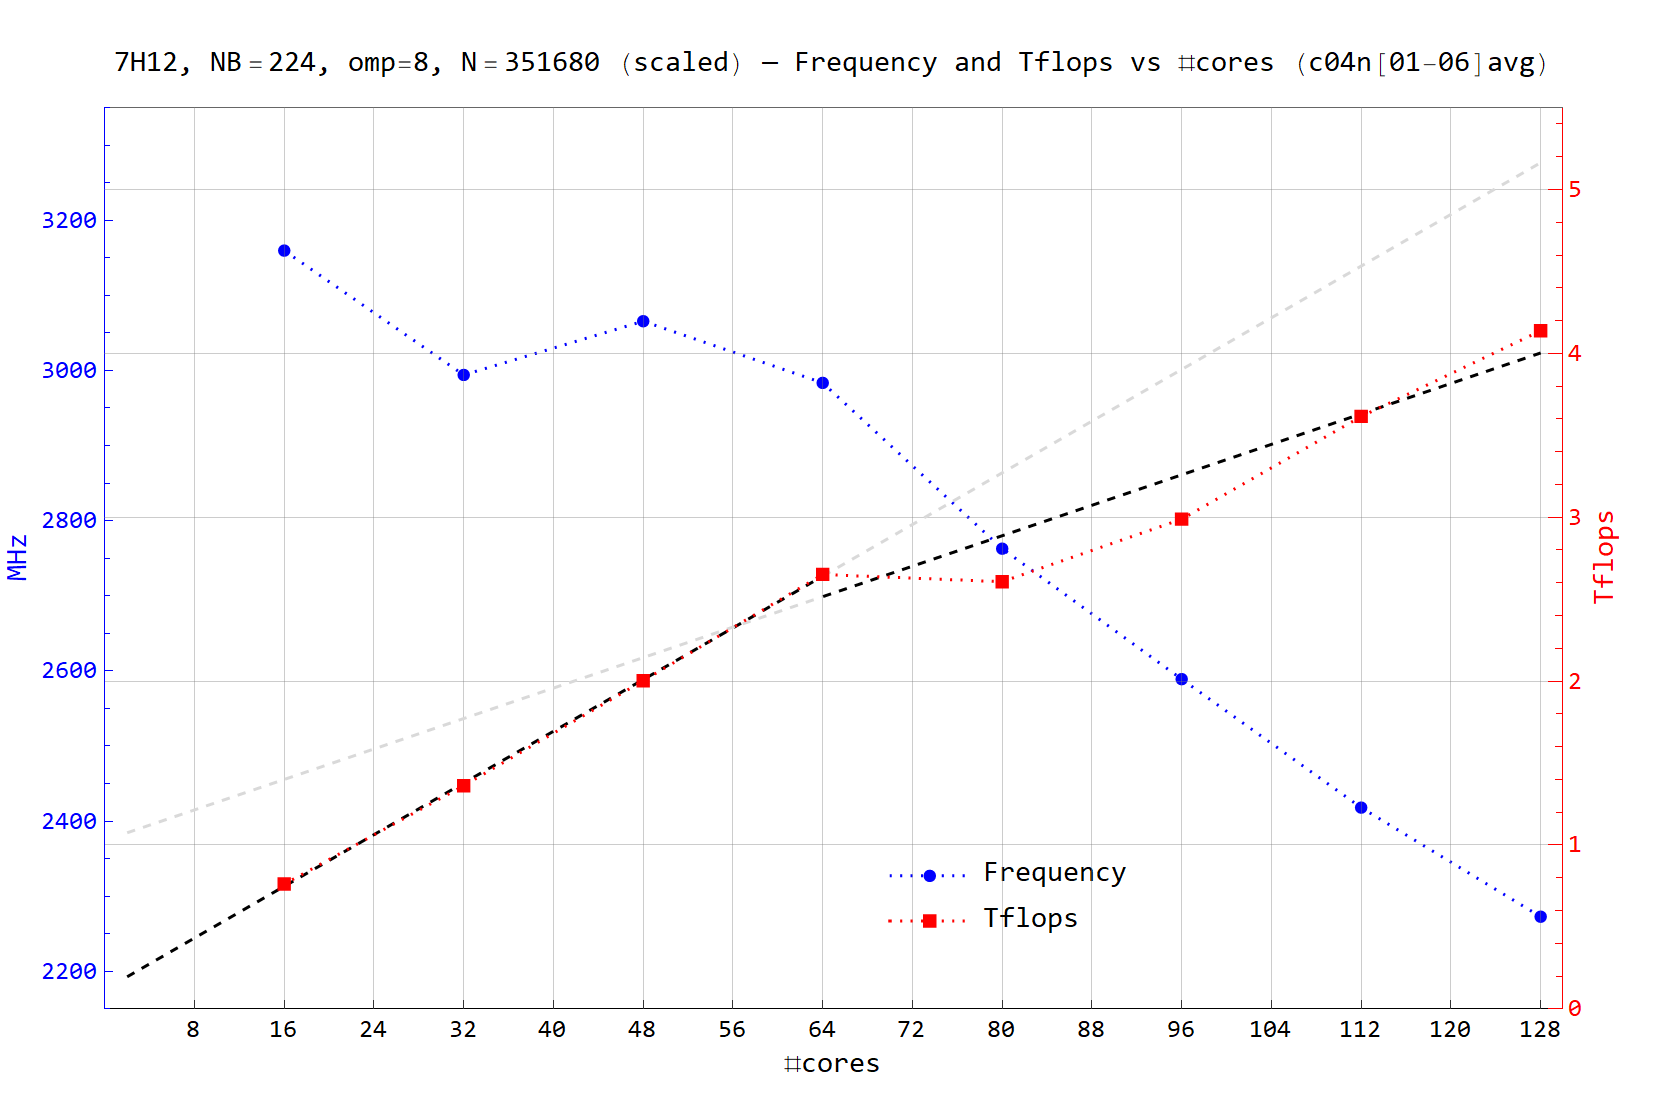
The anomaly appears when more than a half of the 7H12-cores are employed; in particular, there is a significant drop in the CPU frequency & HPL performance when using >64 cores of a dual socket R6525 7H12. As a result, the efficiency of one R6525 7H12 node appears to be 20-25% lower than the efficiency of two R6525 7502 nodes connected via InfiniBand (or equally, two R6525 7H12 nodes with half of the cores used).
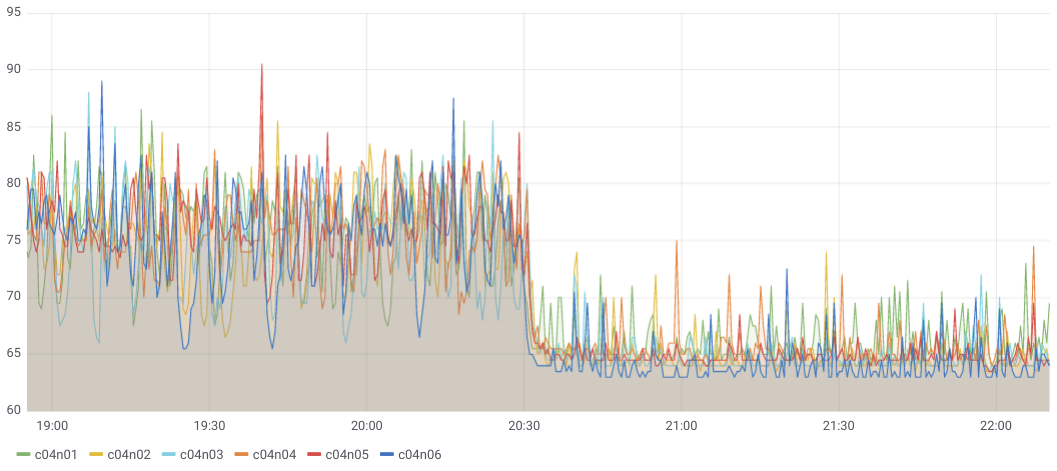
Note that the performance degradation is not thermal. Forcing all the fans to operate at 100% PWM cools down the CPUs from 75 degC to 65 degC during the tests. This CPU cooling, however, only slightly increases the observed performance (~1%).
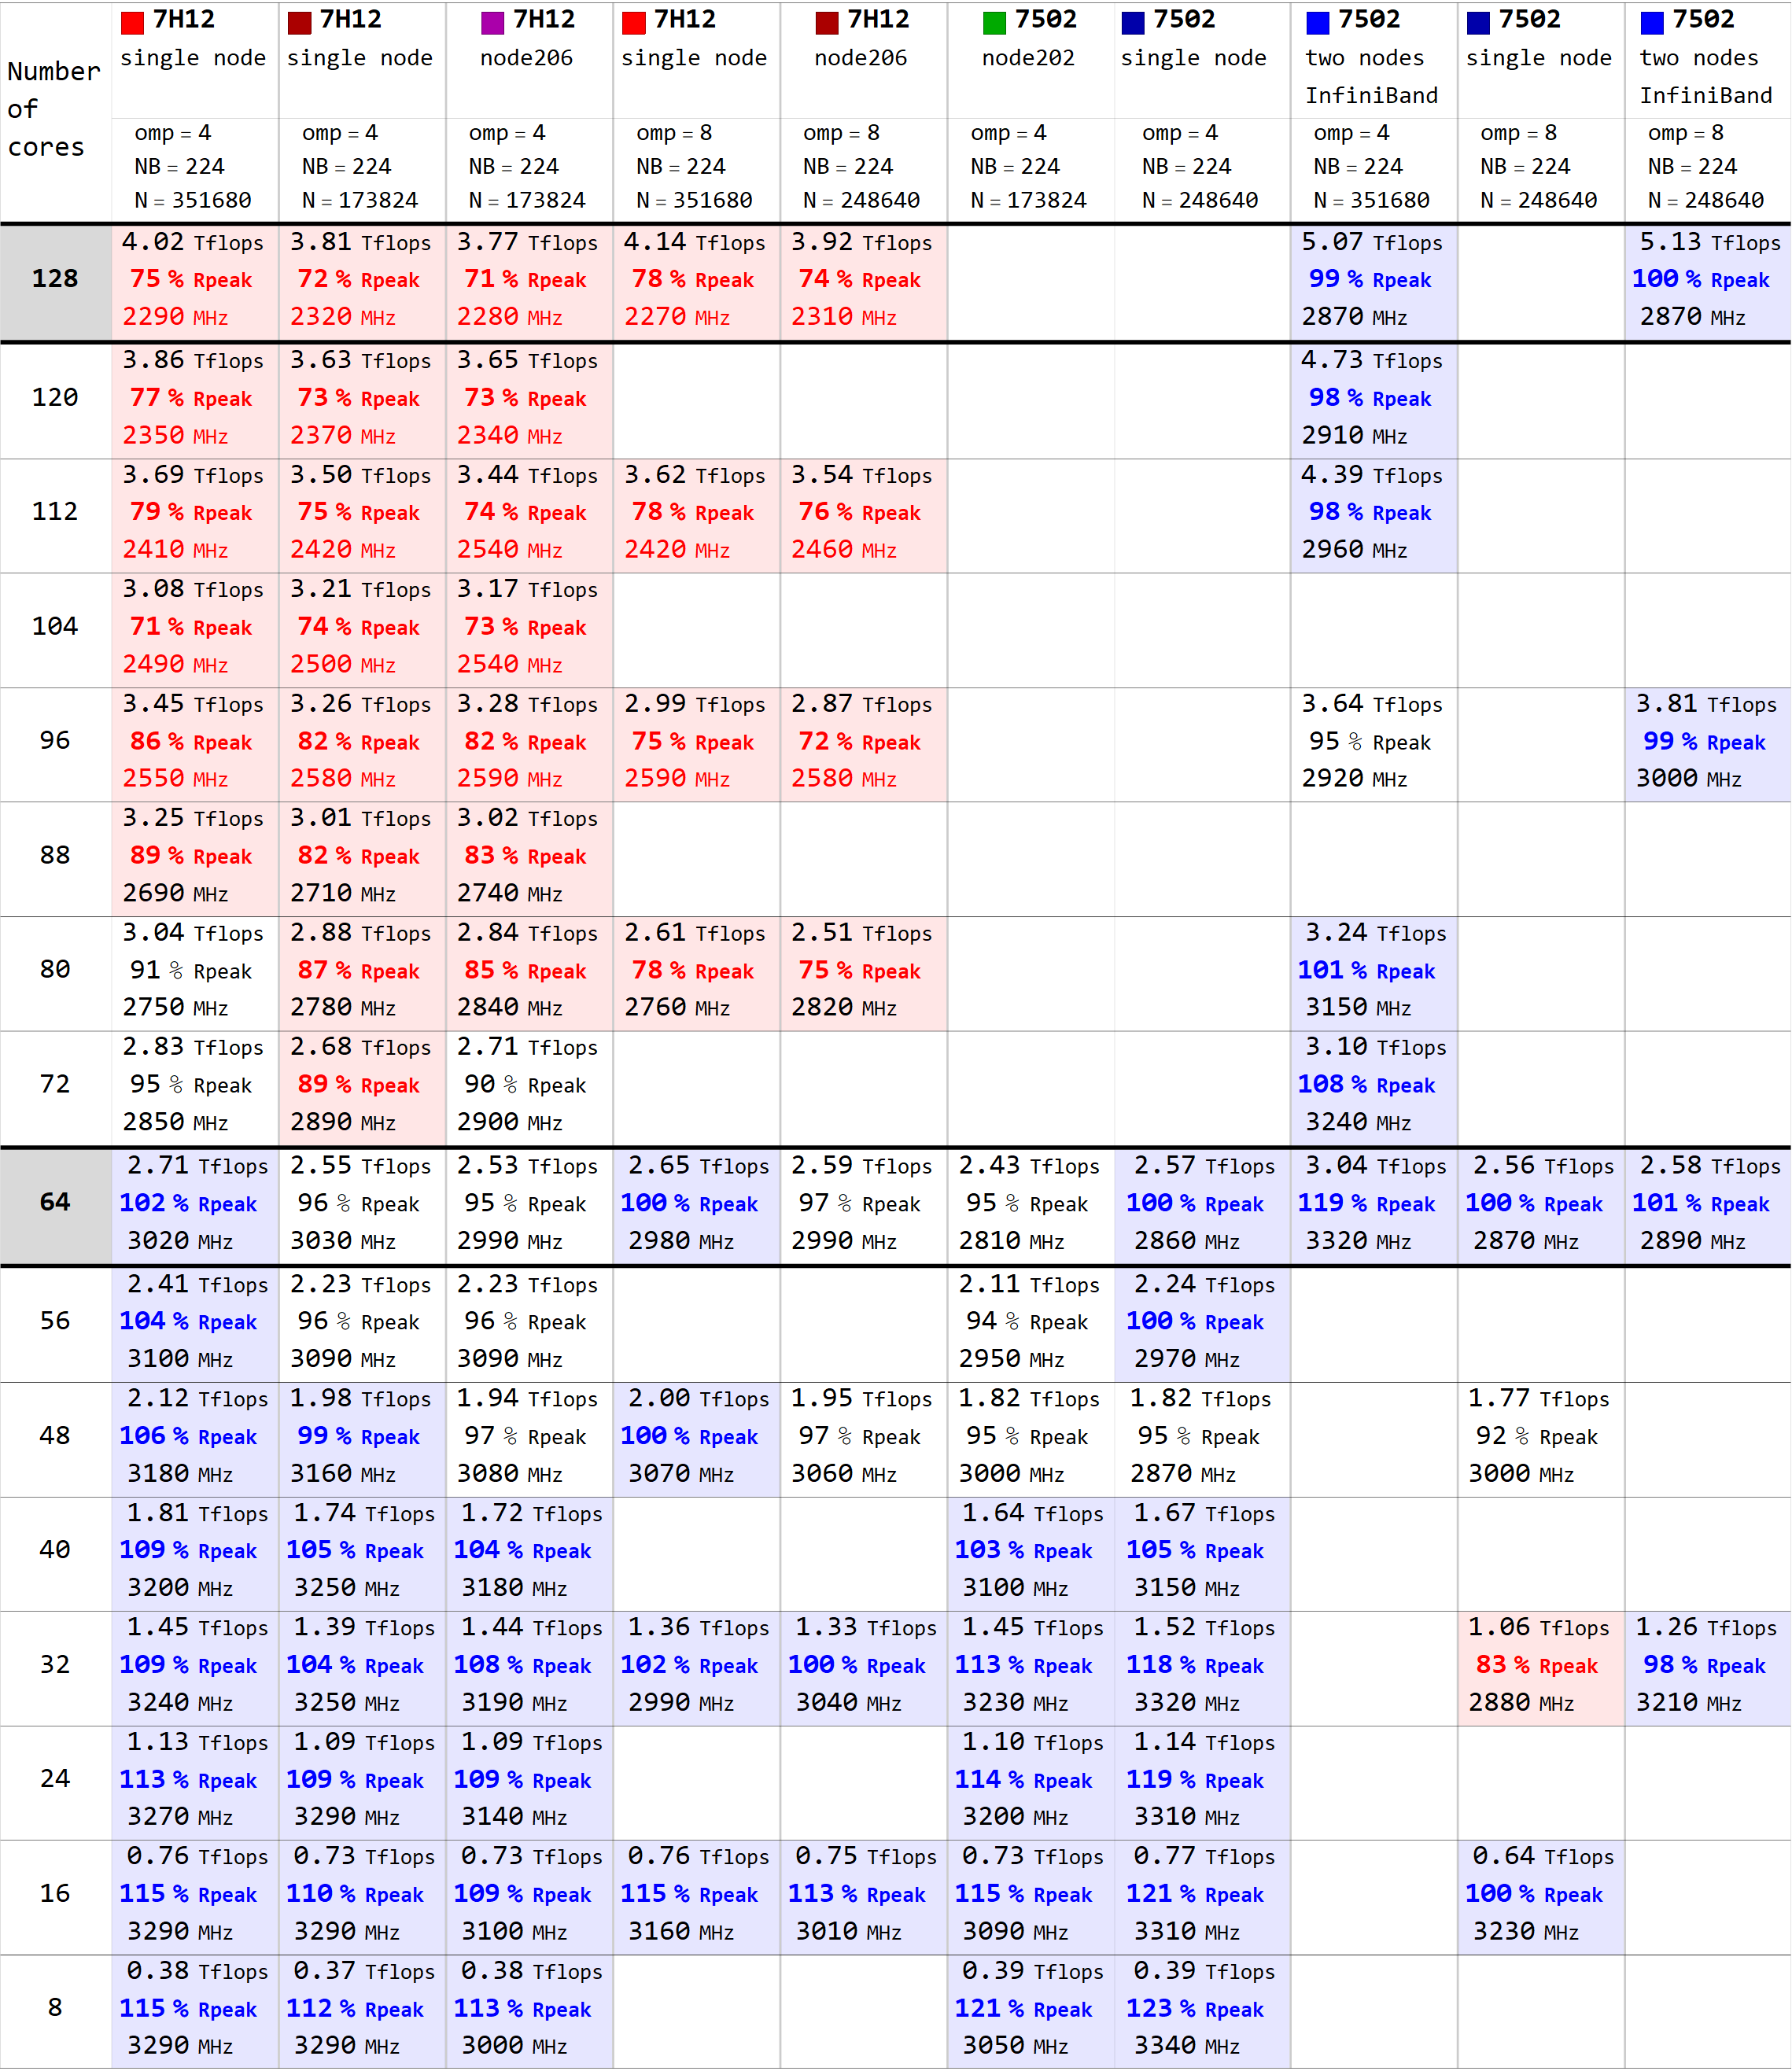
Table 1 contains an overview of the observed HPL performance & CPU frequency for typical tests. The performance anomaly for 7H12 is visible for >64 cores (highlighted in red). Note that the Rpeak performance of an EPYC Rome/Zen2 CPU is calculated as:
Rpeak/flops = number of cores * 16 * frequency/HzHere, the nominal CPU frequency of 7H12 is 2.6 GHz, while the nominal CPU frequency of 7502 is 2.5 GHz. This gives Rpeak(2x7H12) = 5.32 Tflops and Rpeak(2x7502) = 2.56 Tflops.
Table 1. Major test results
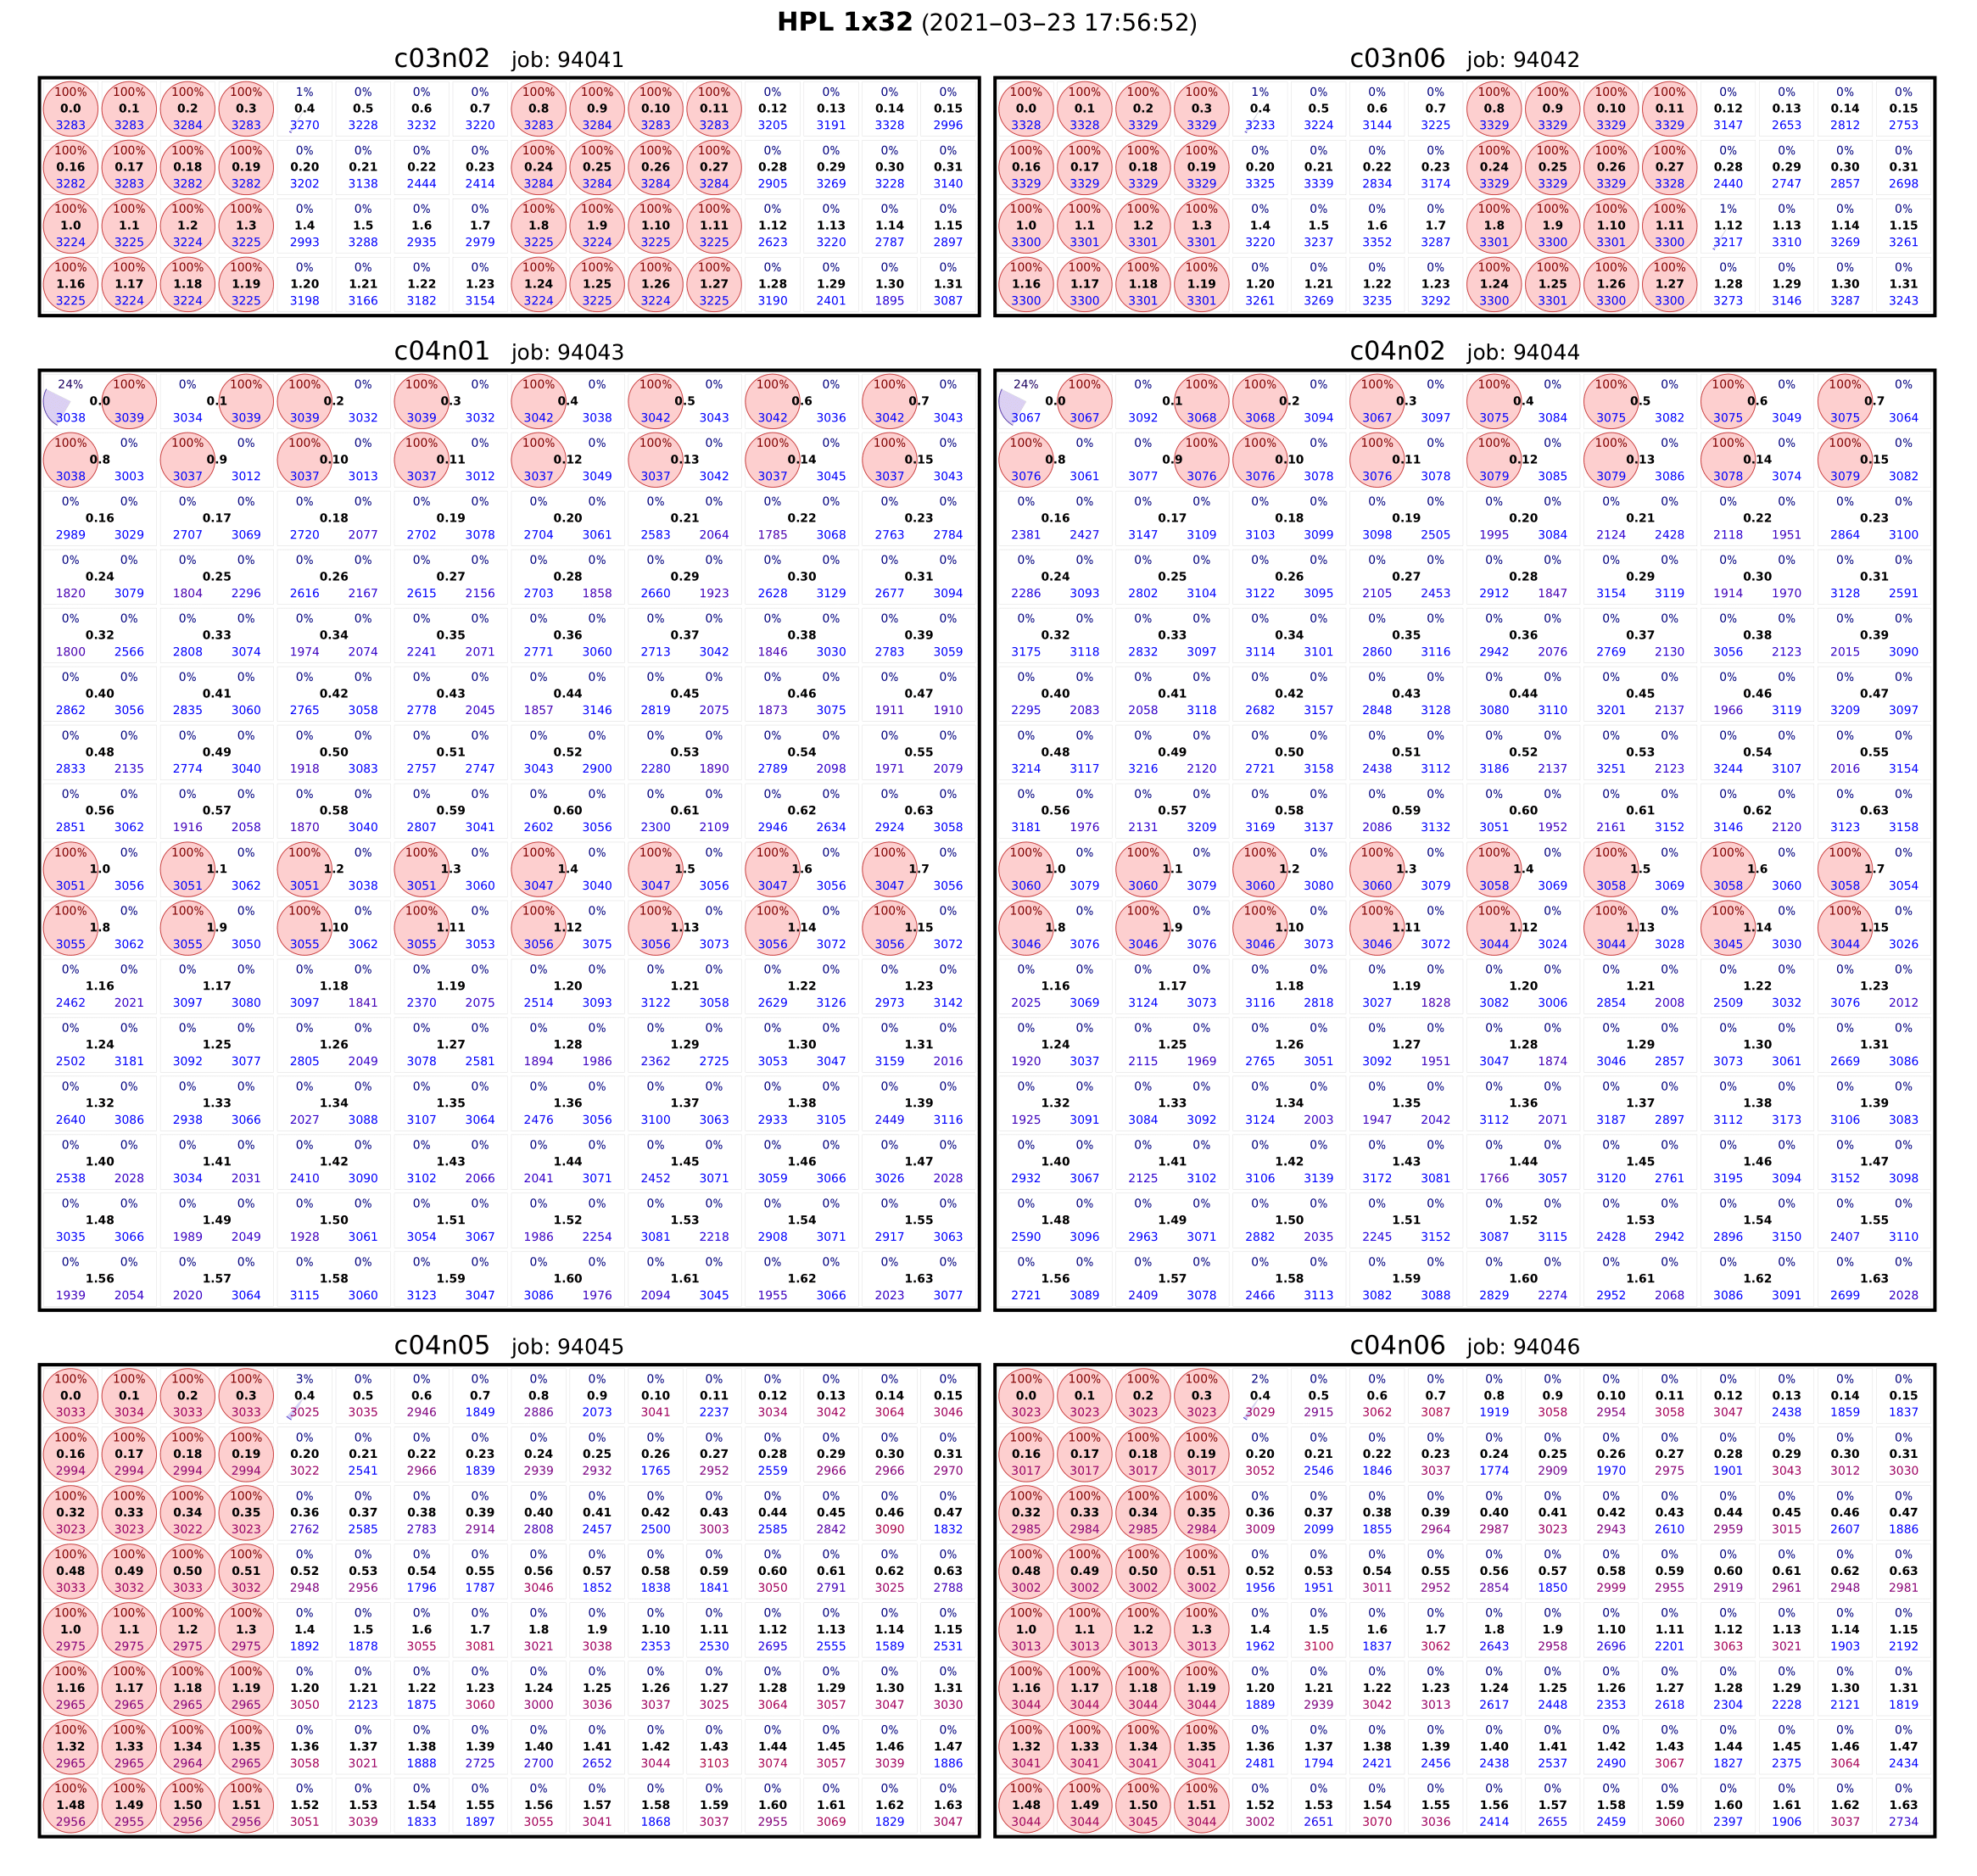
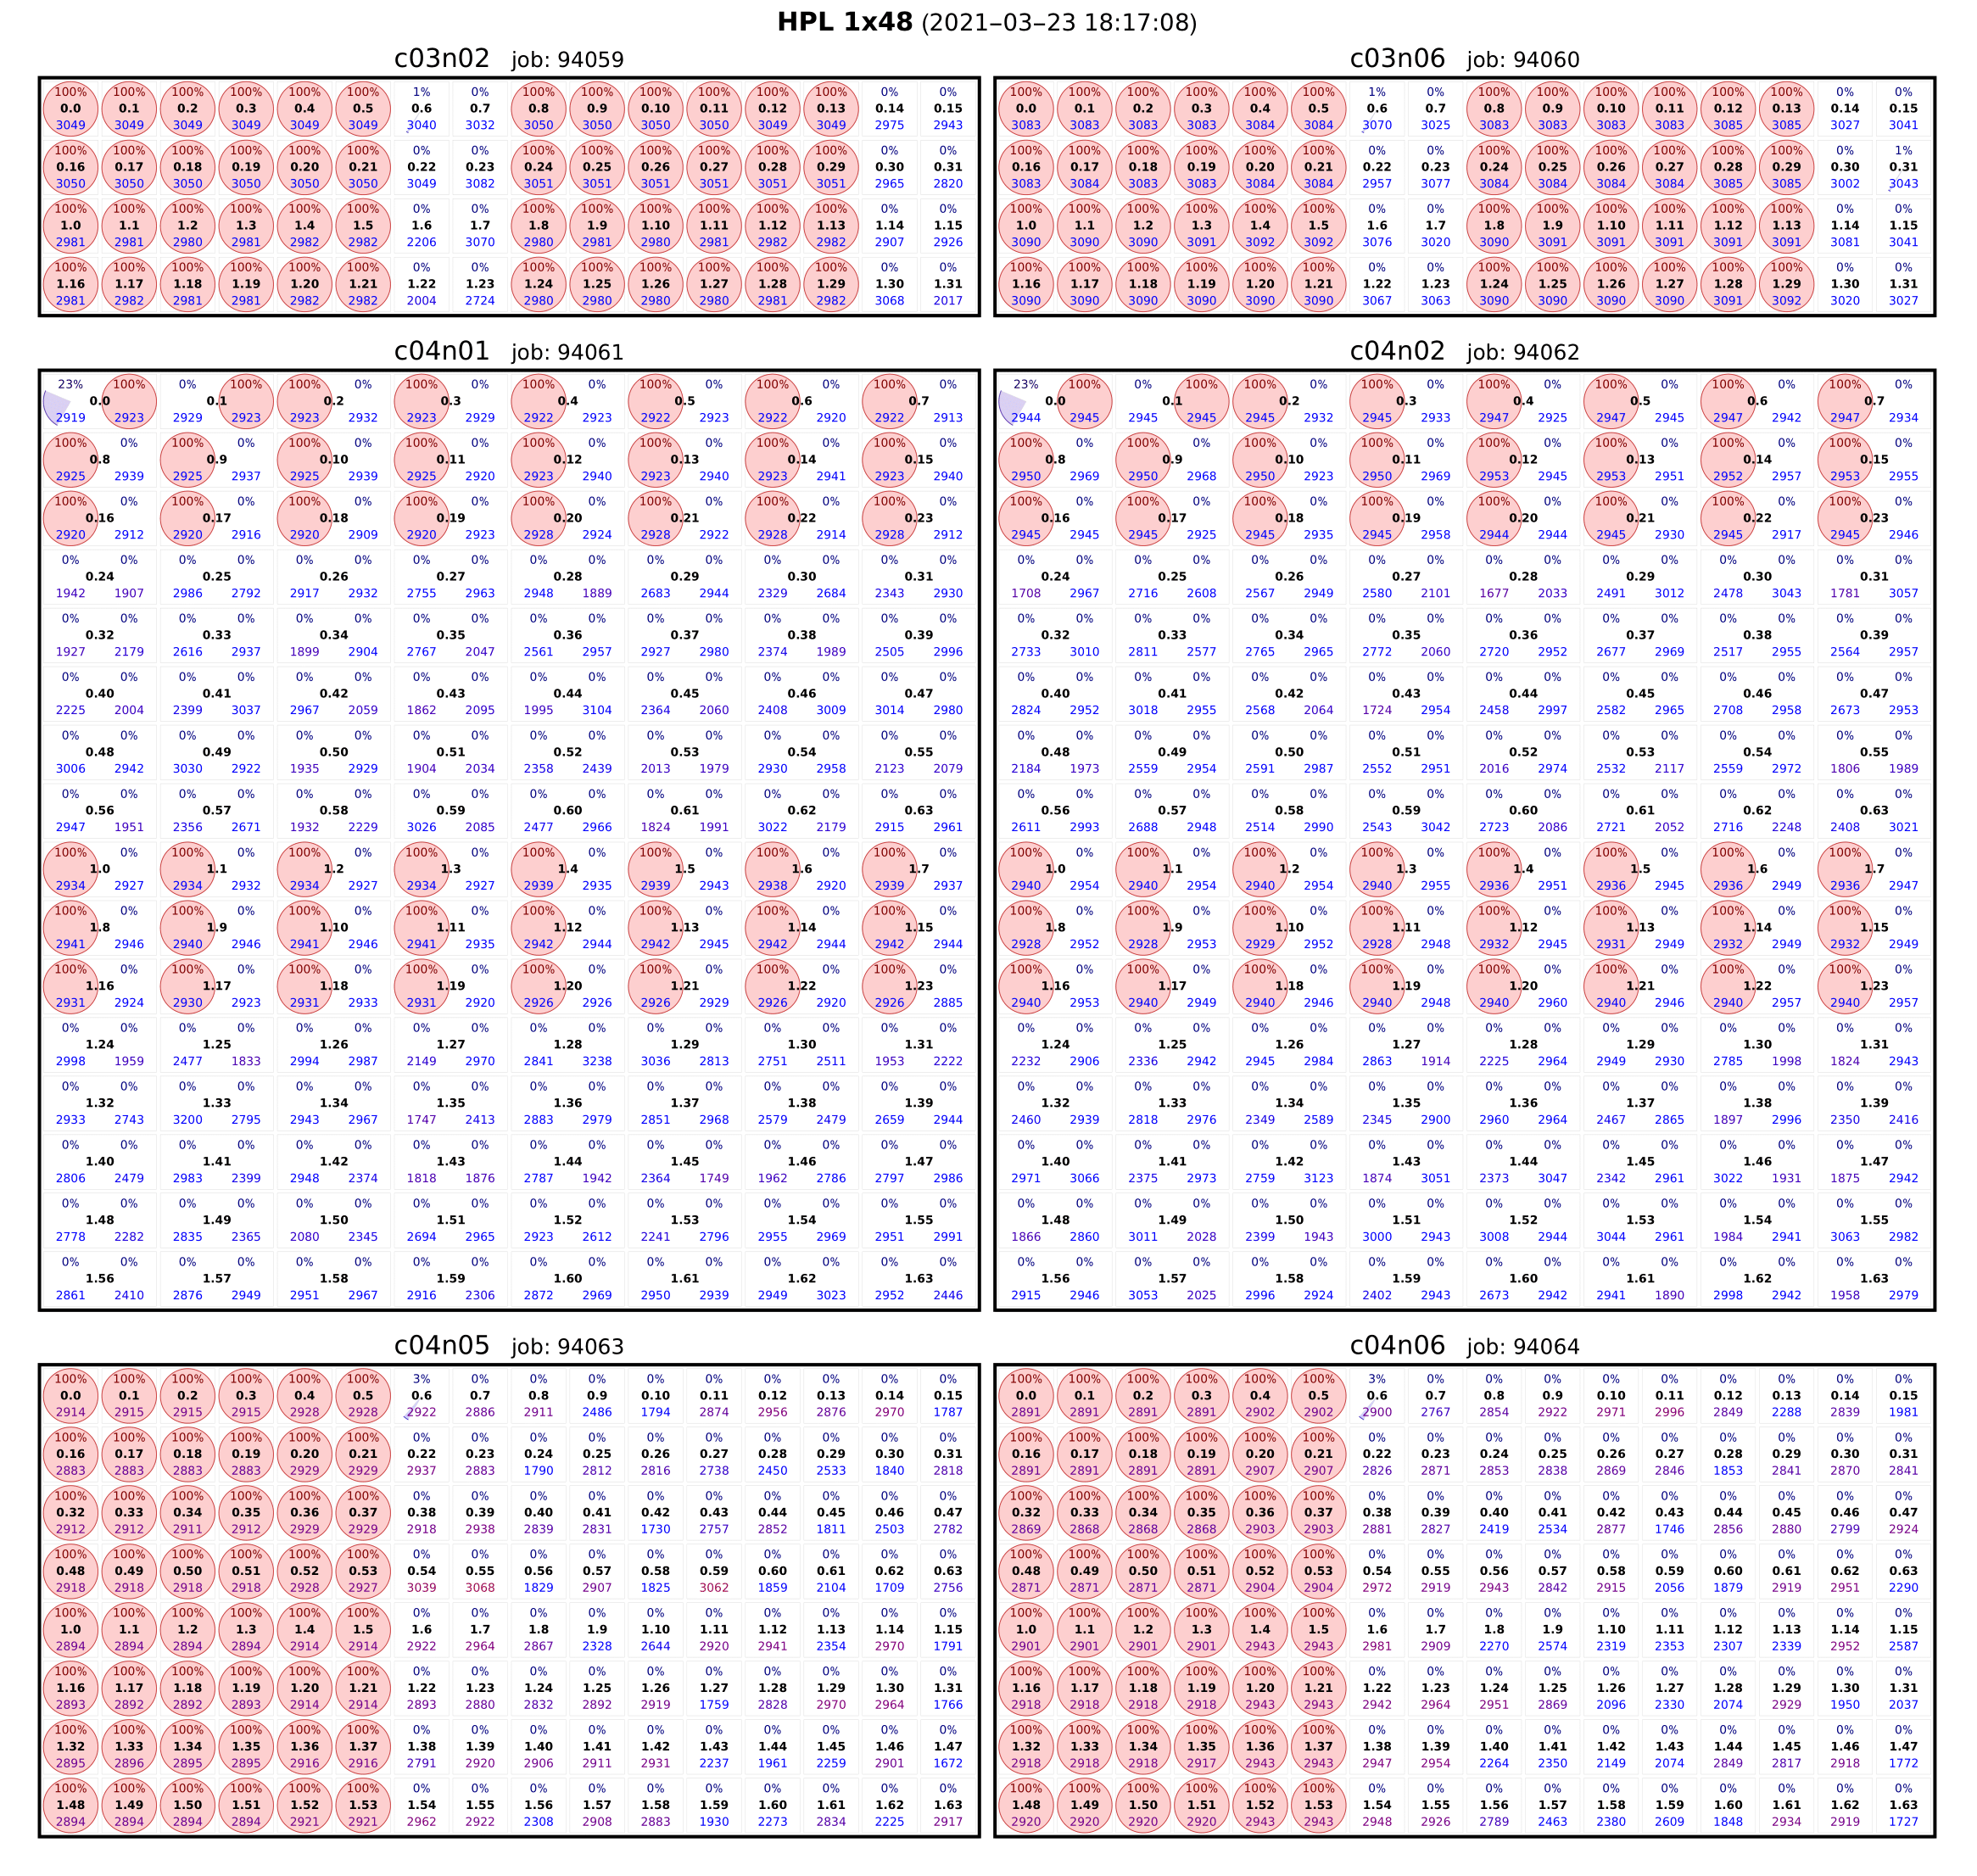
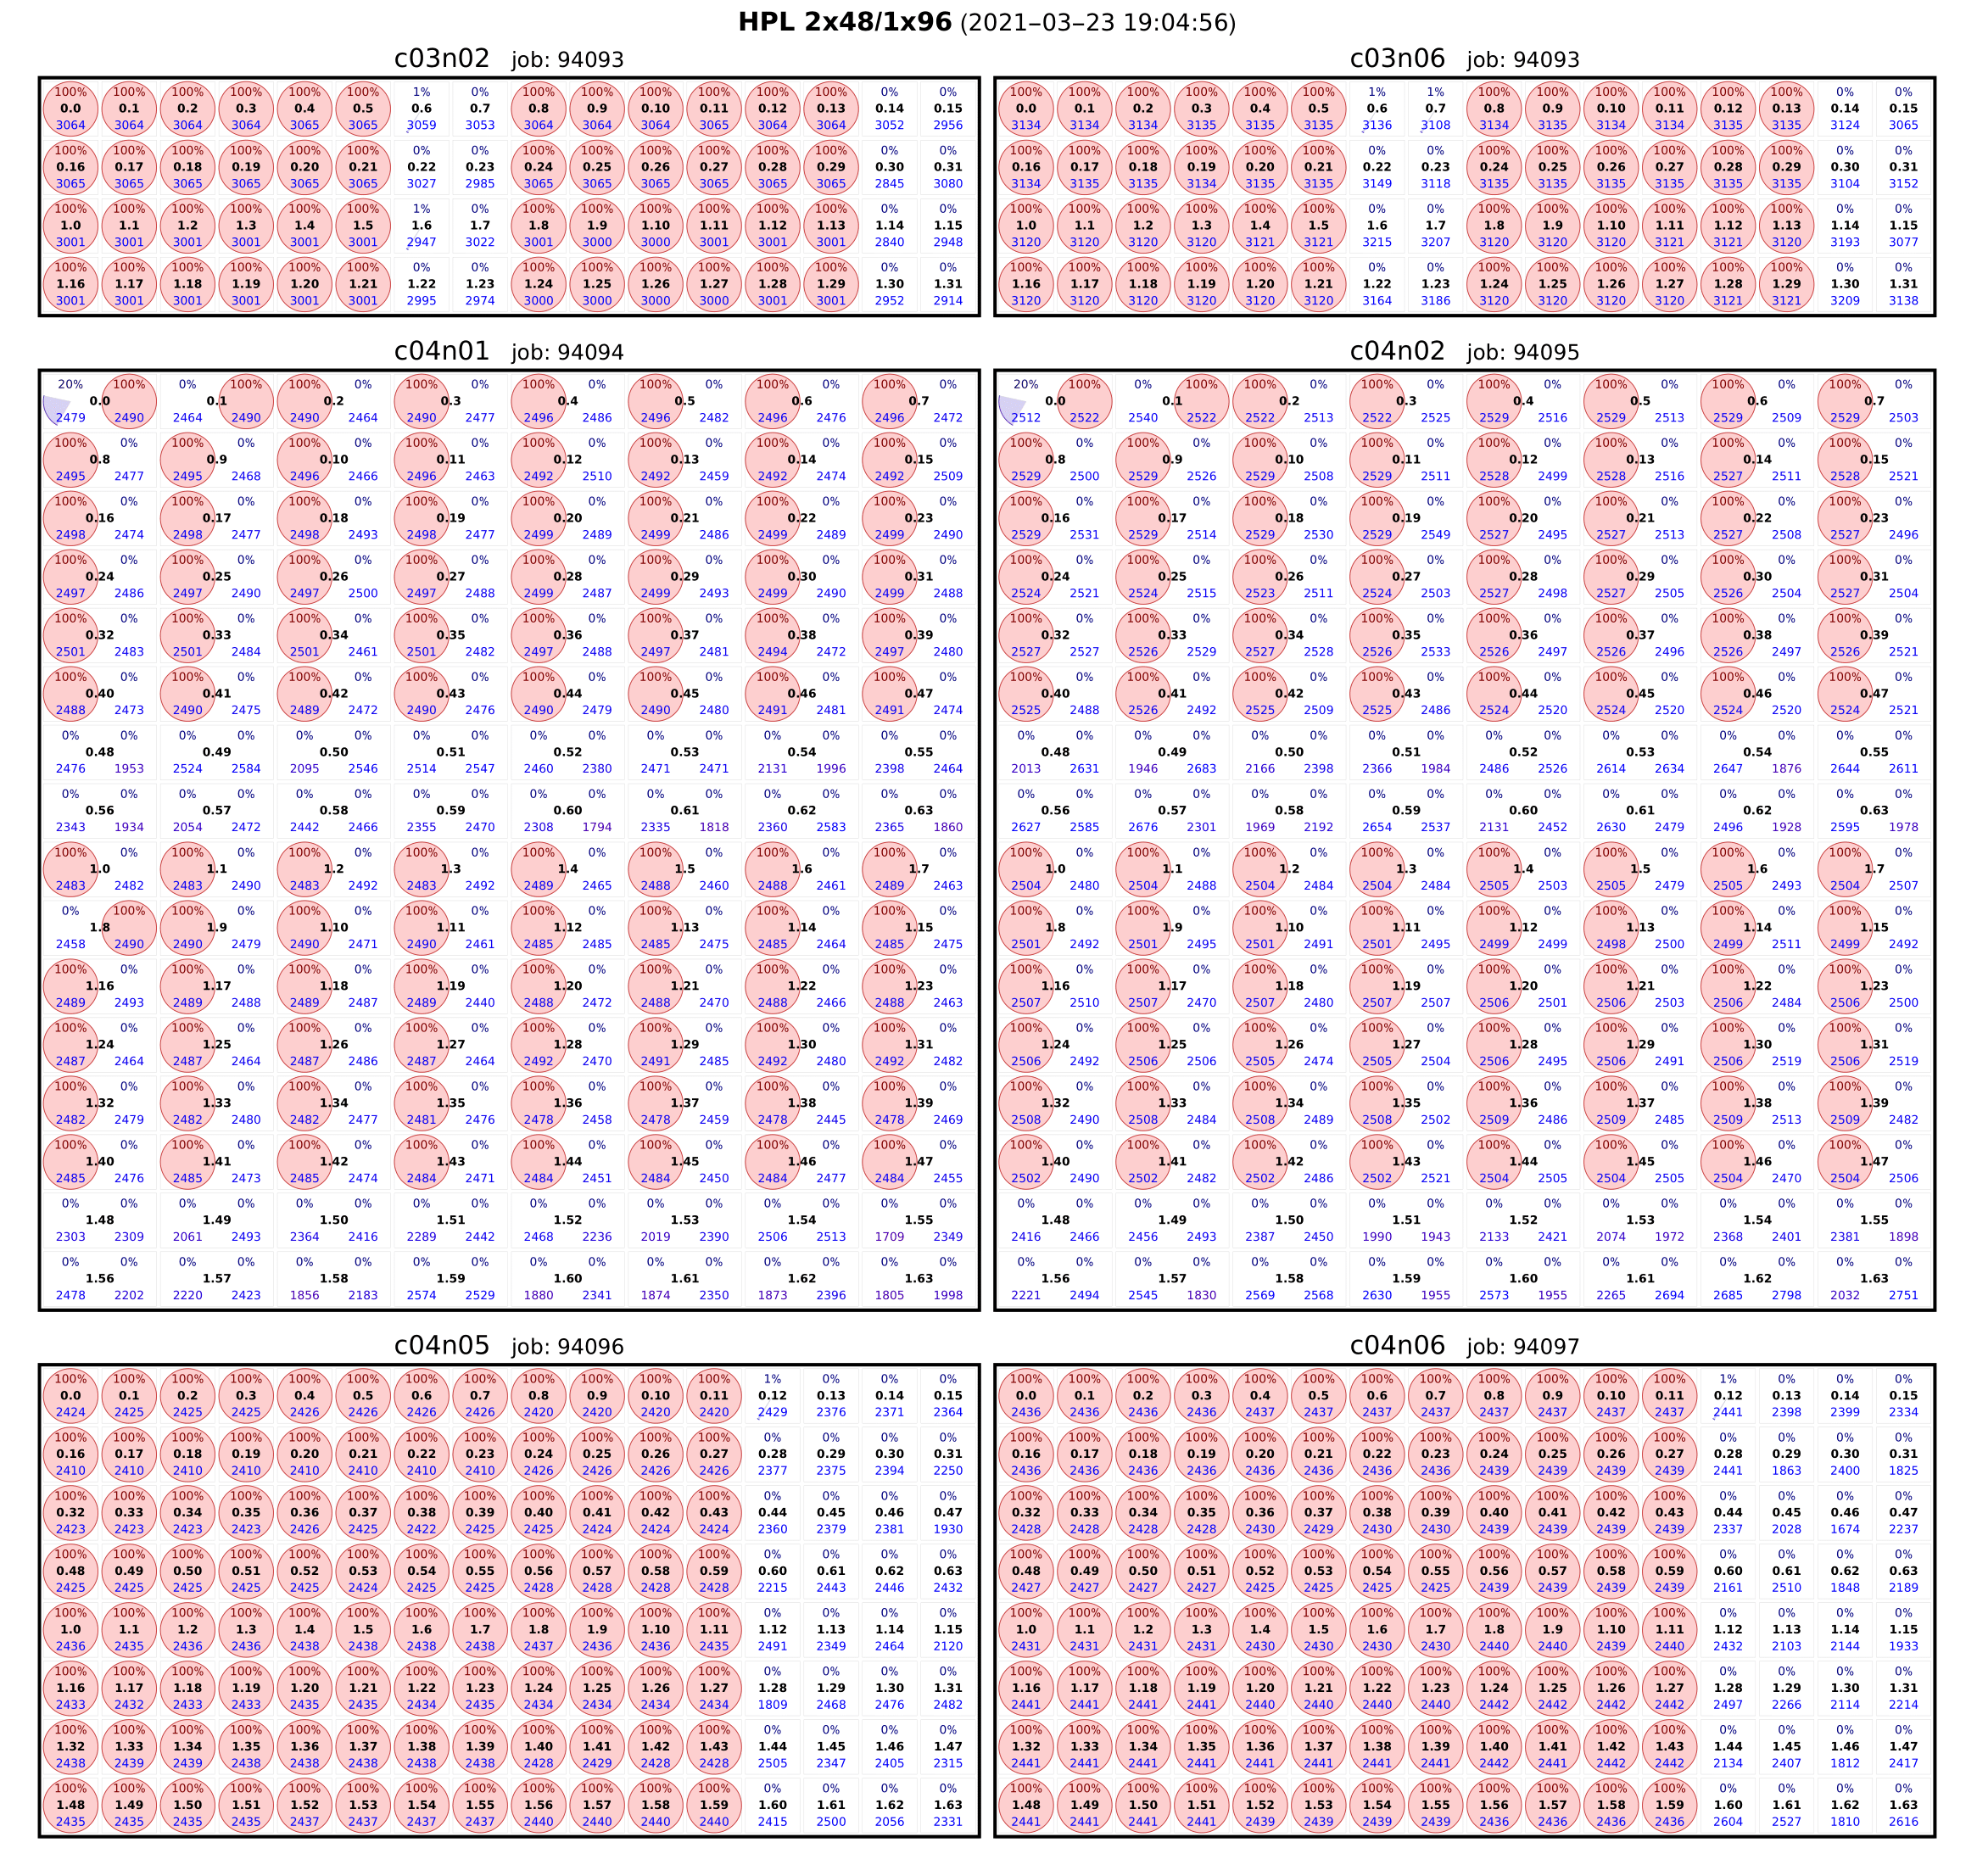
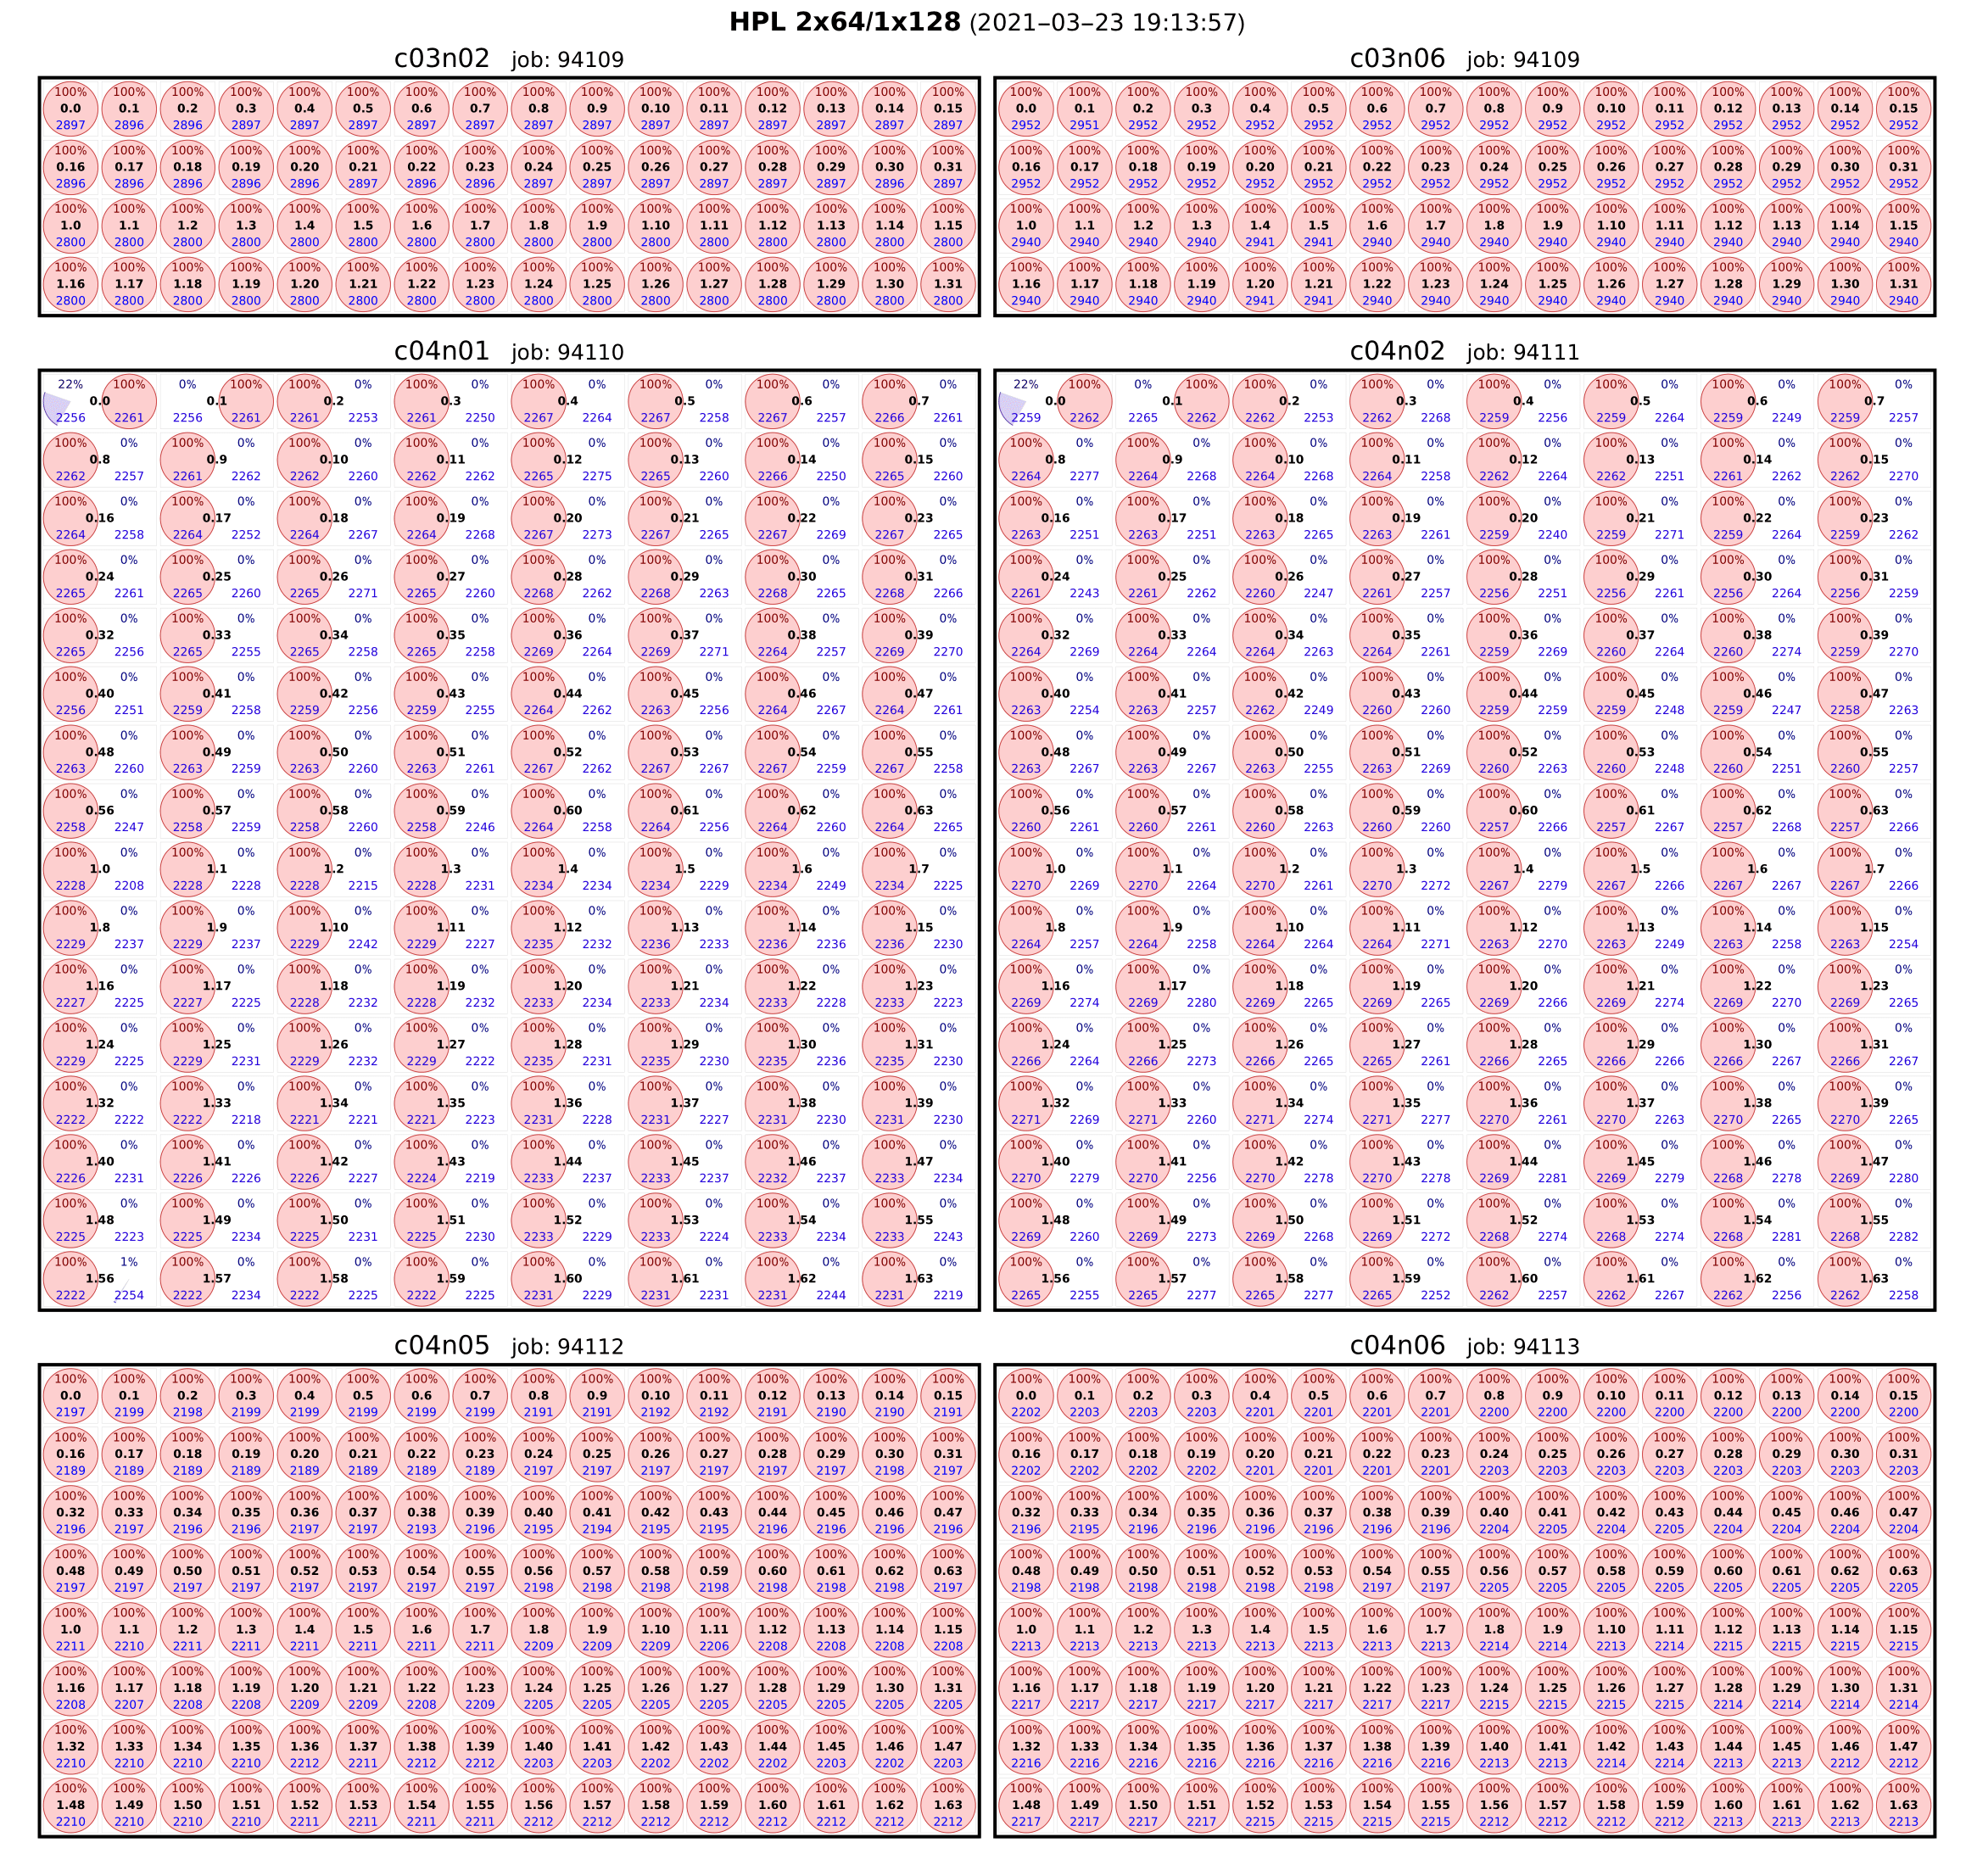
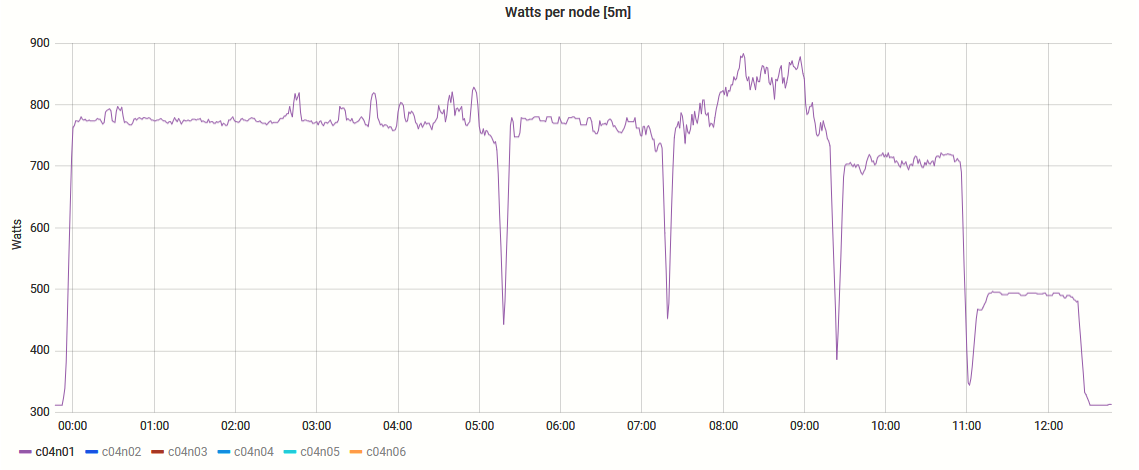
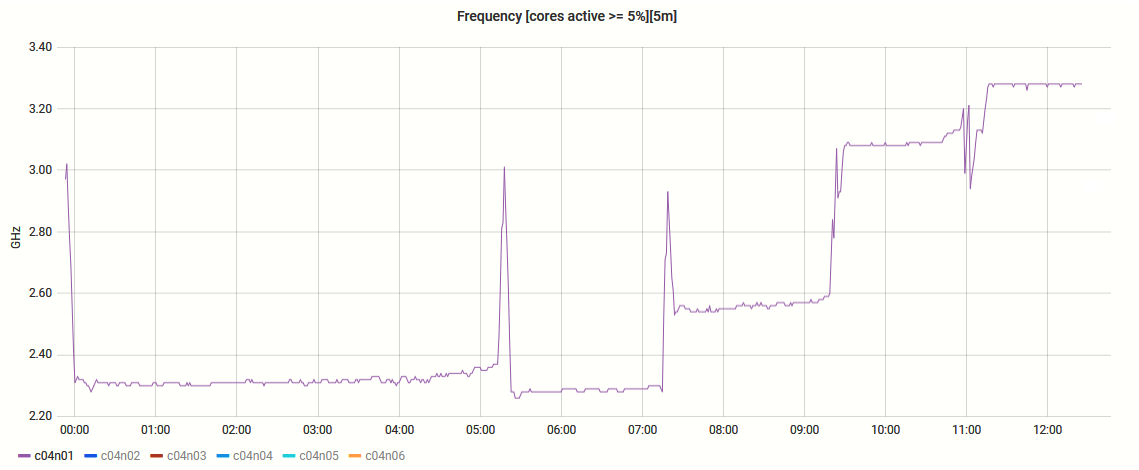
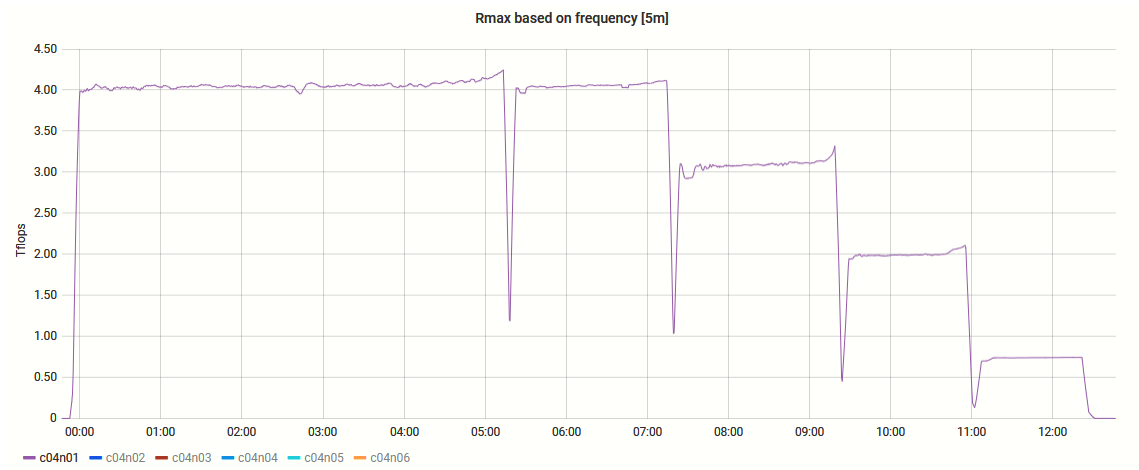
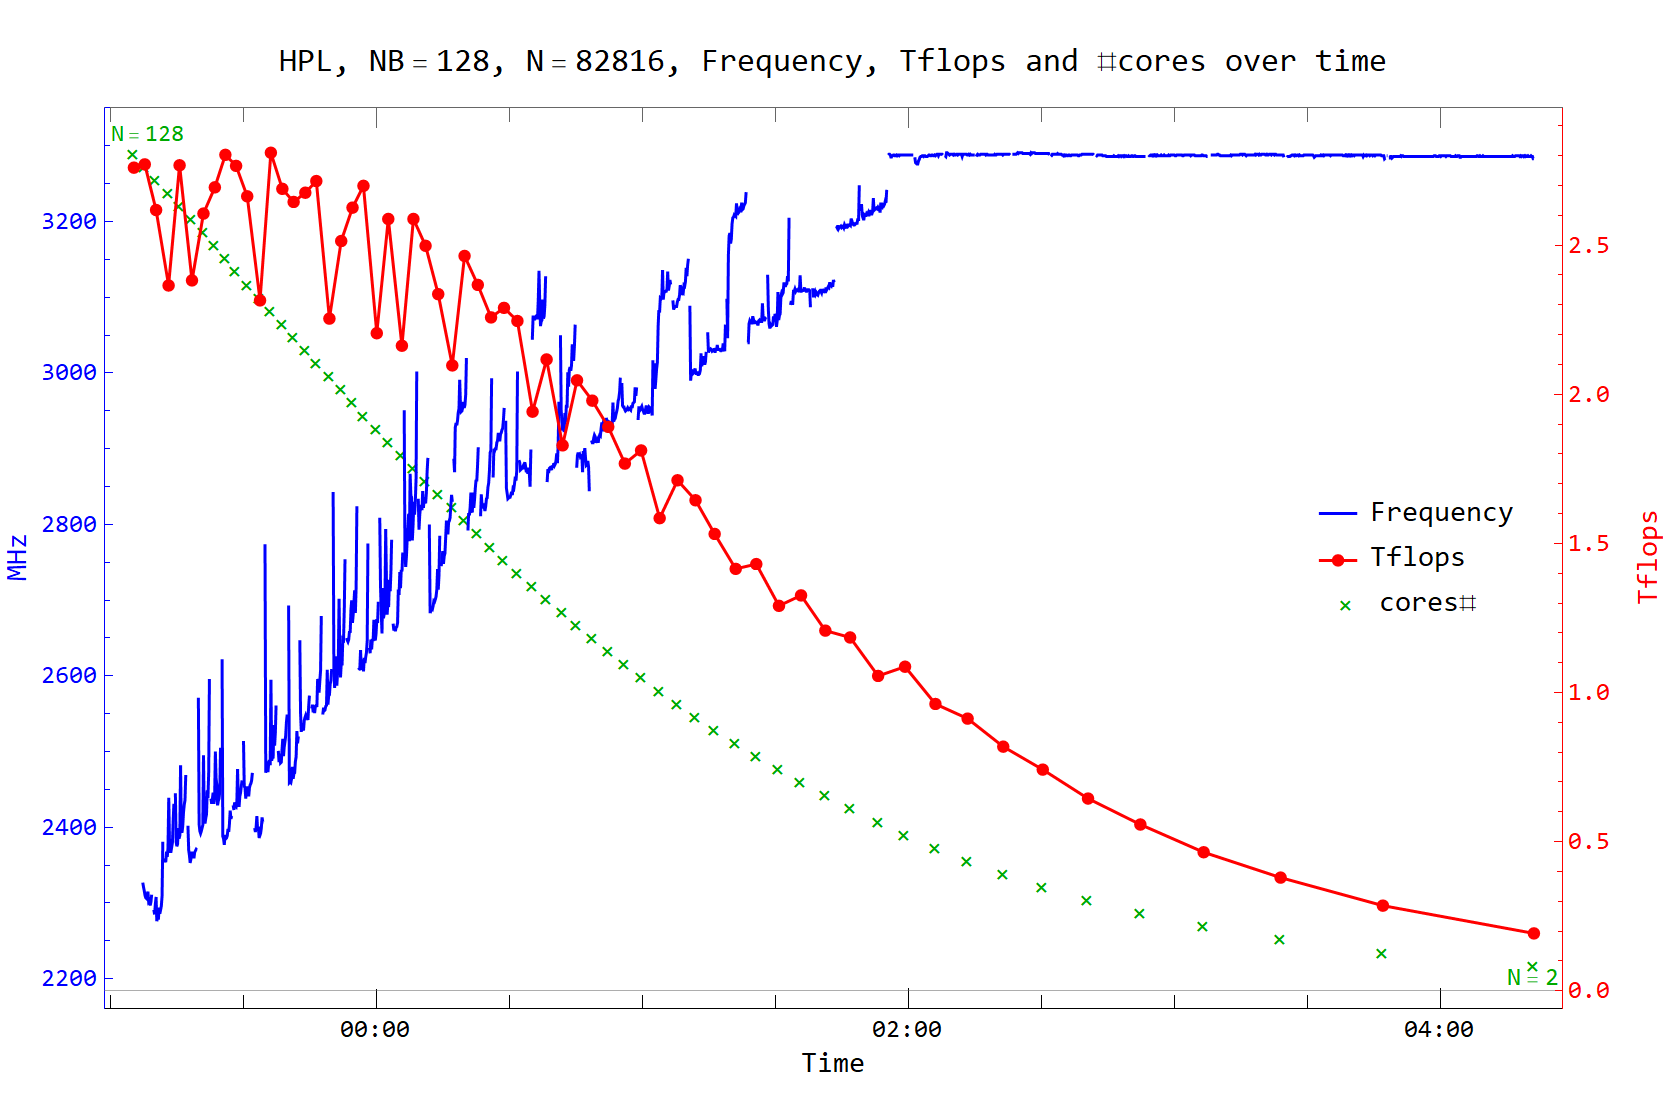
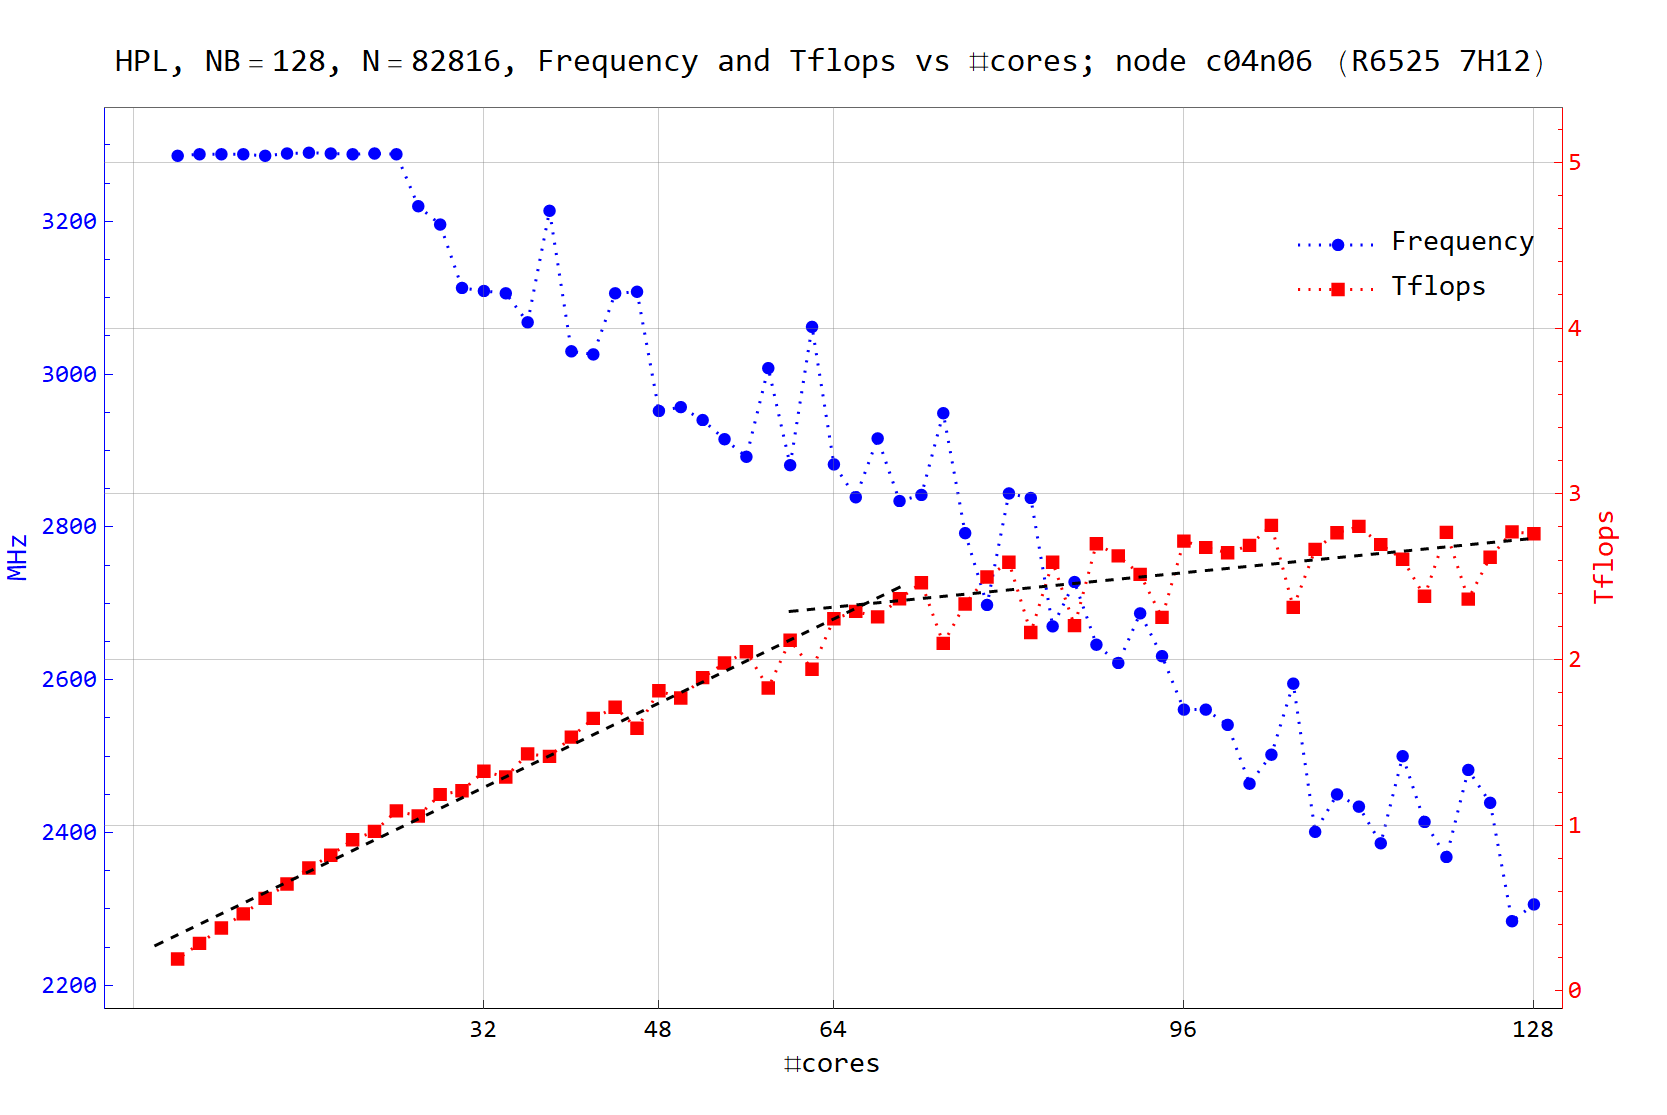
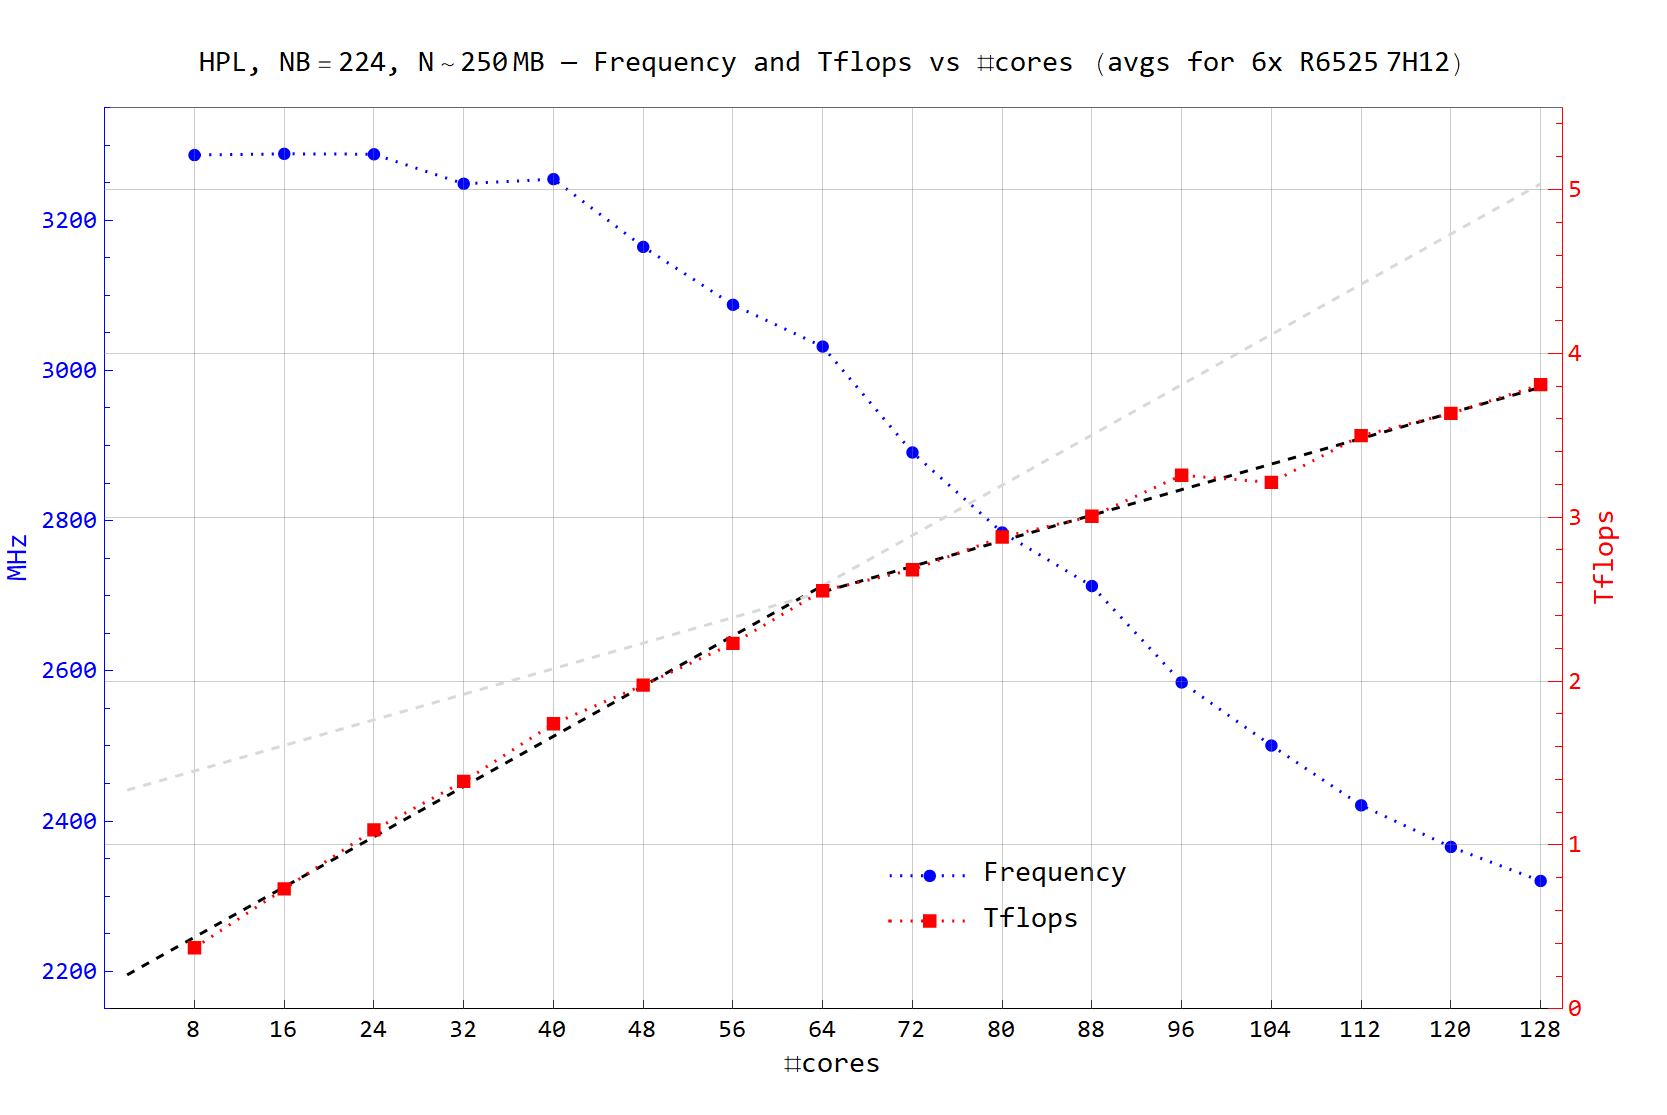
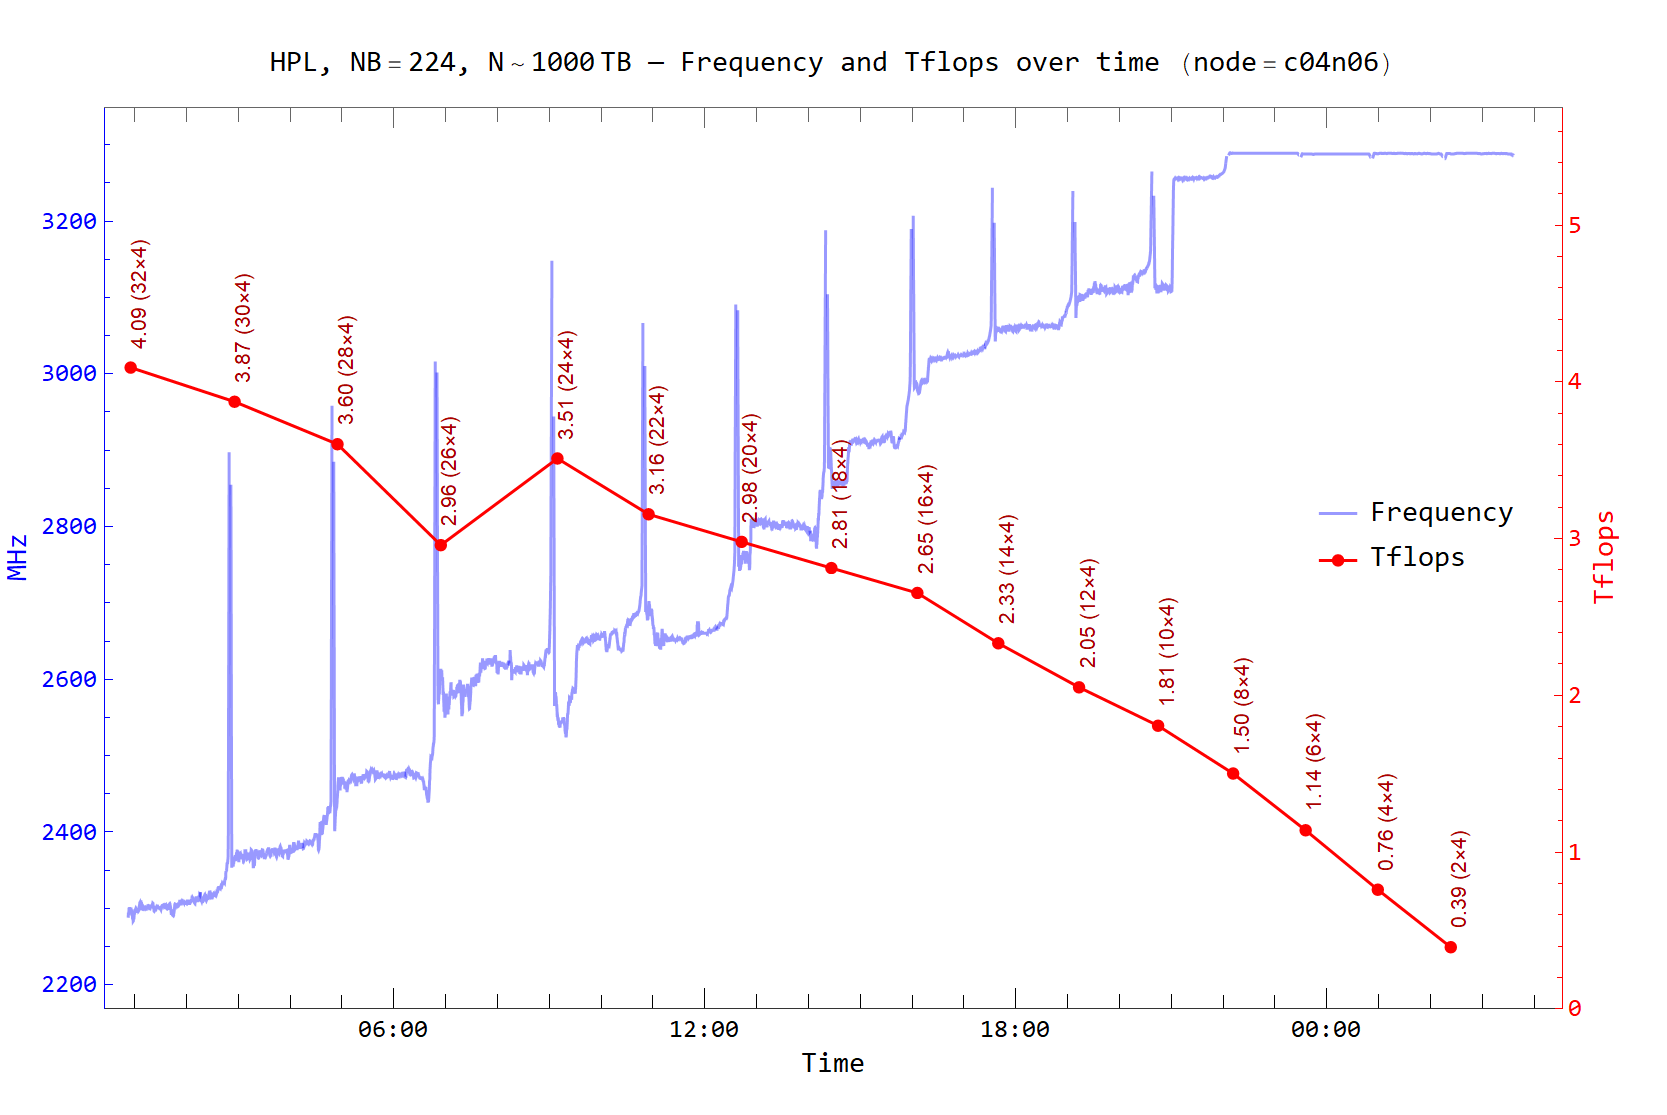
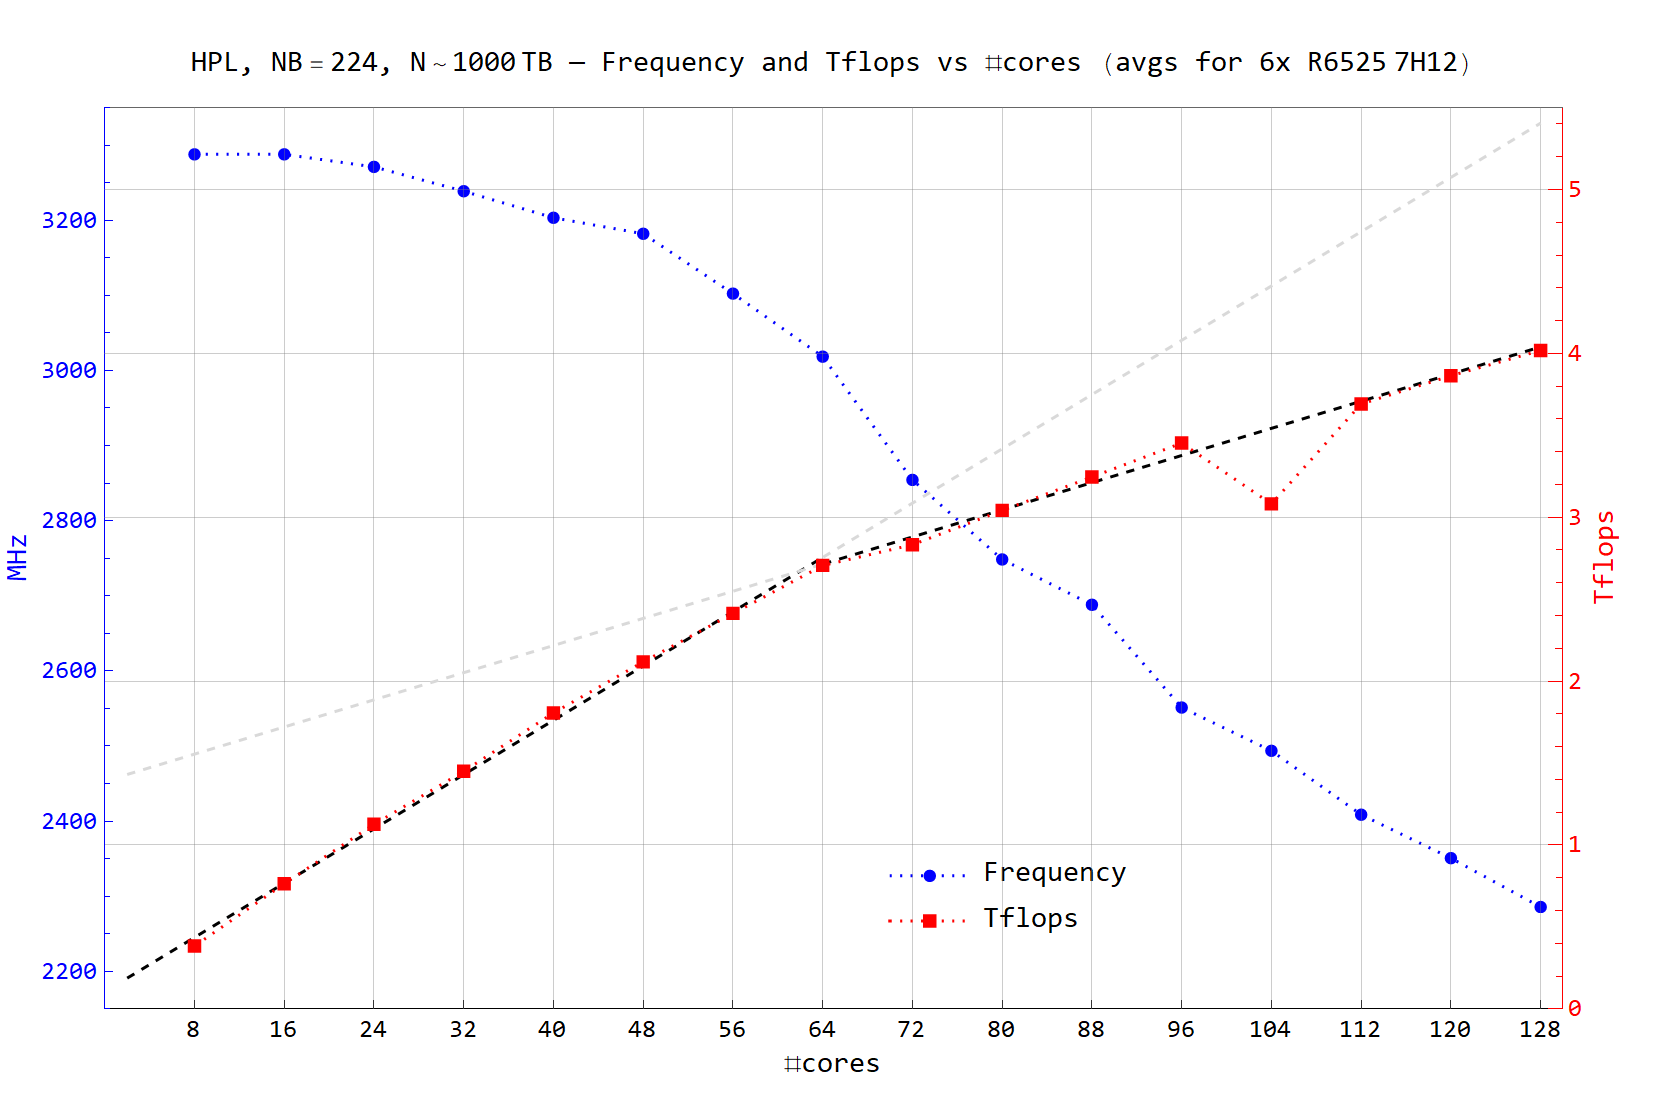
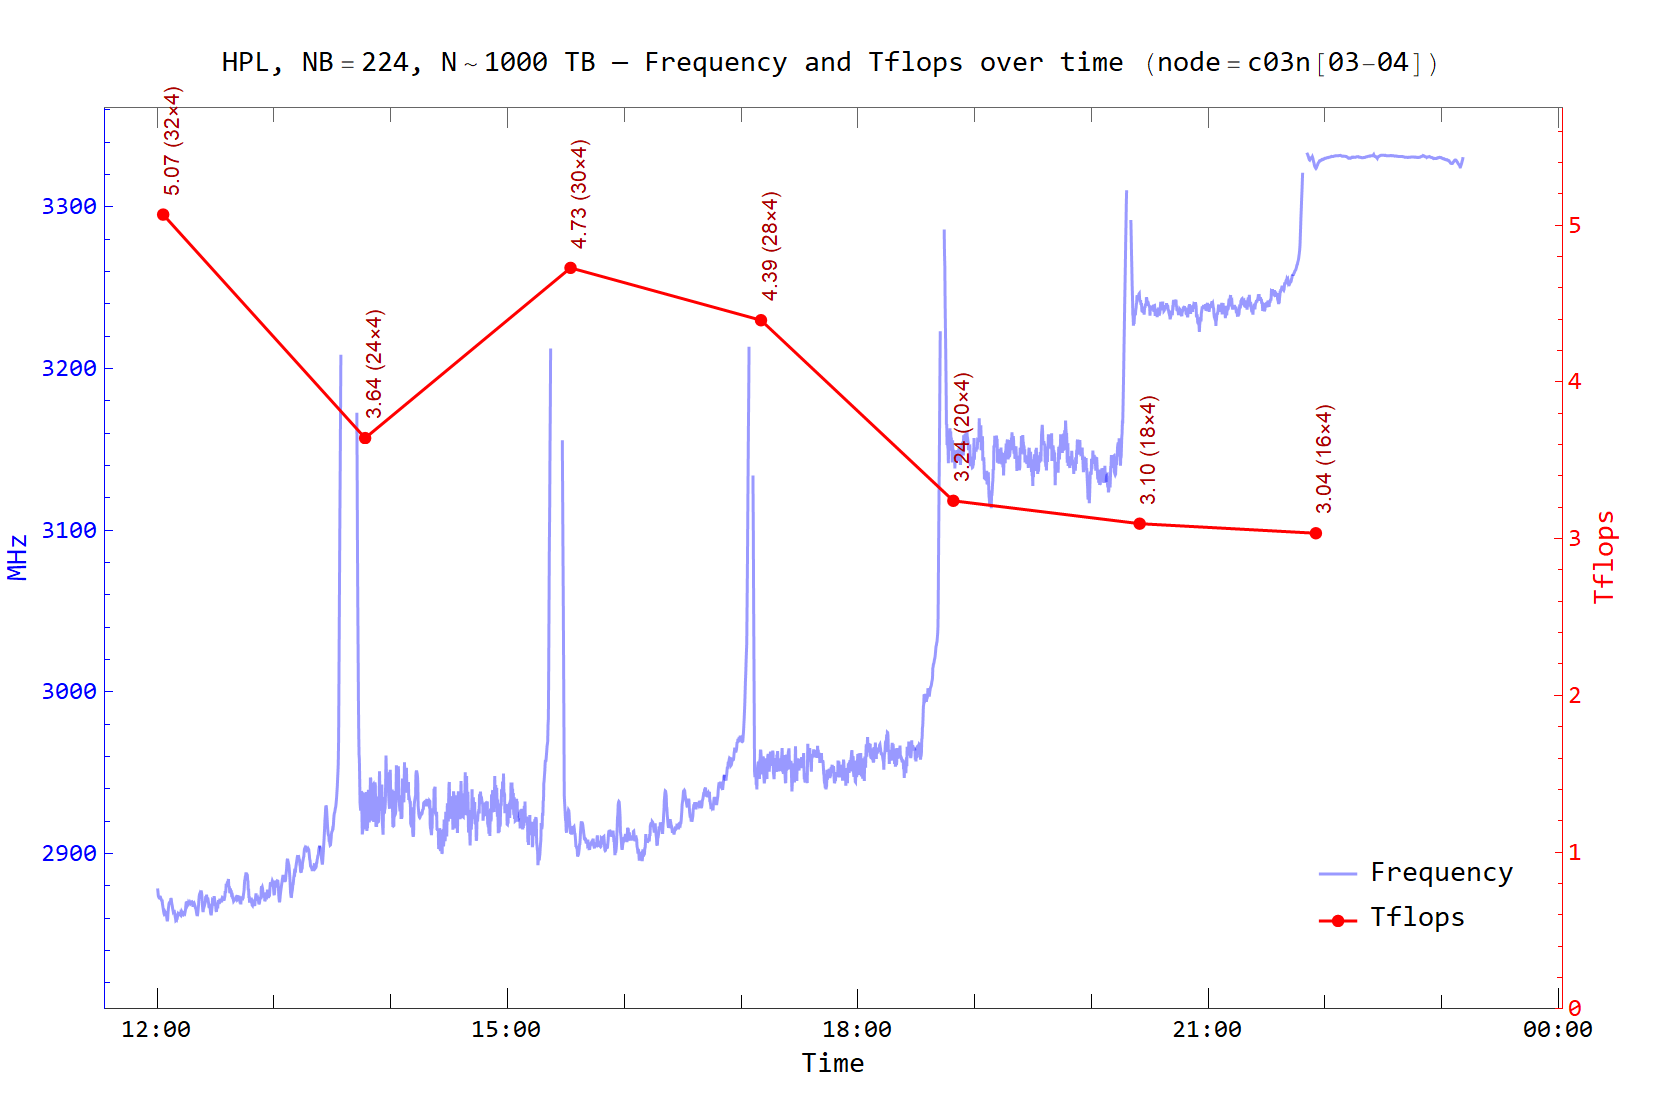
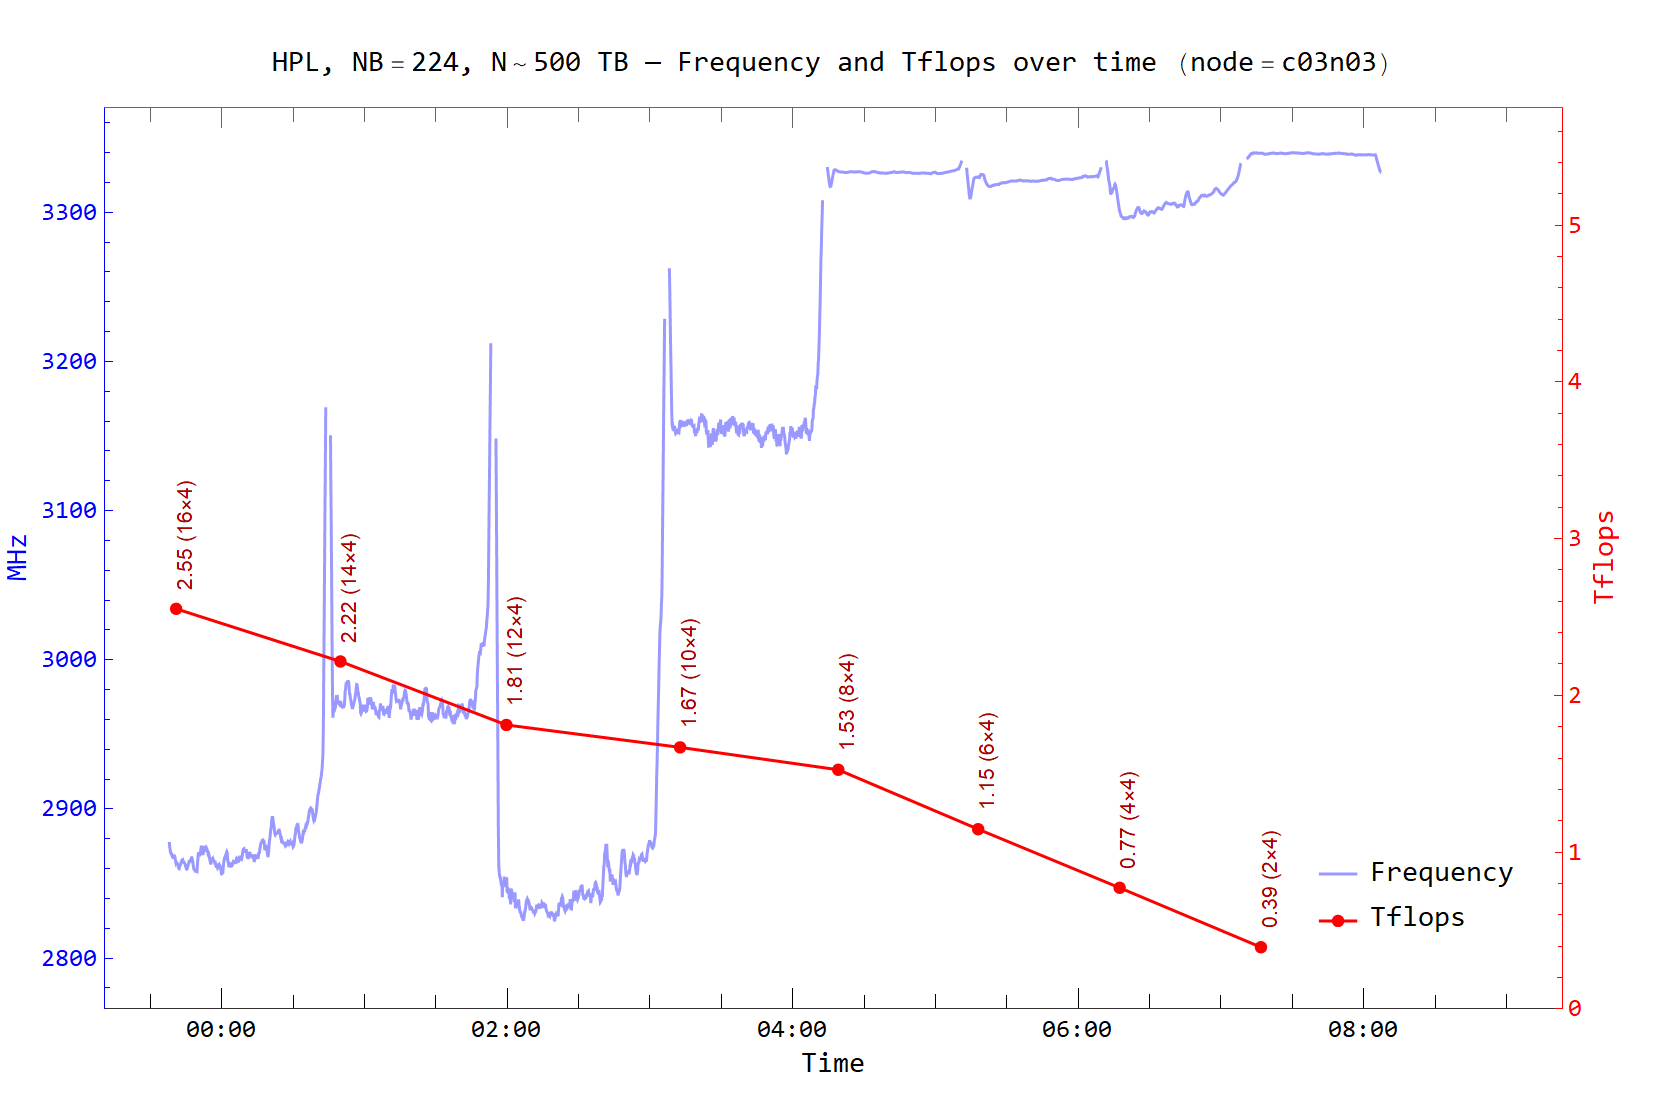
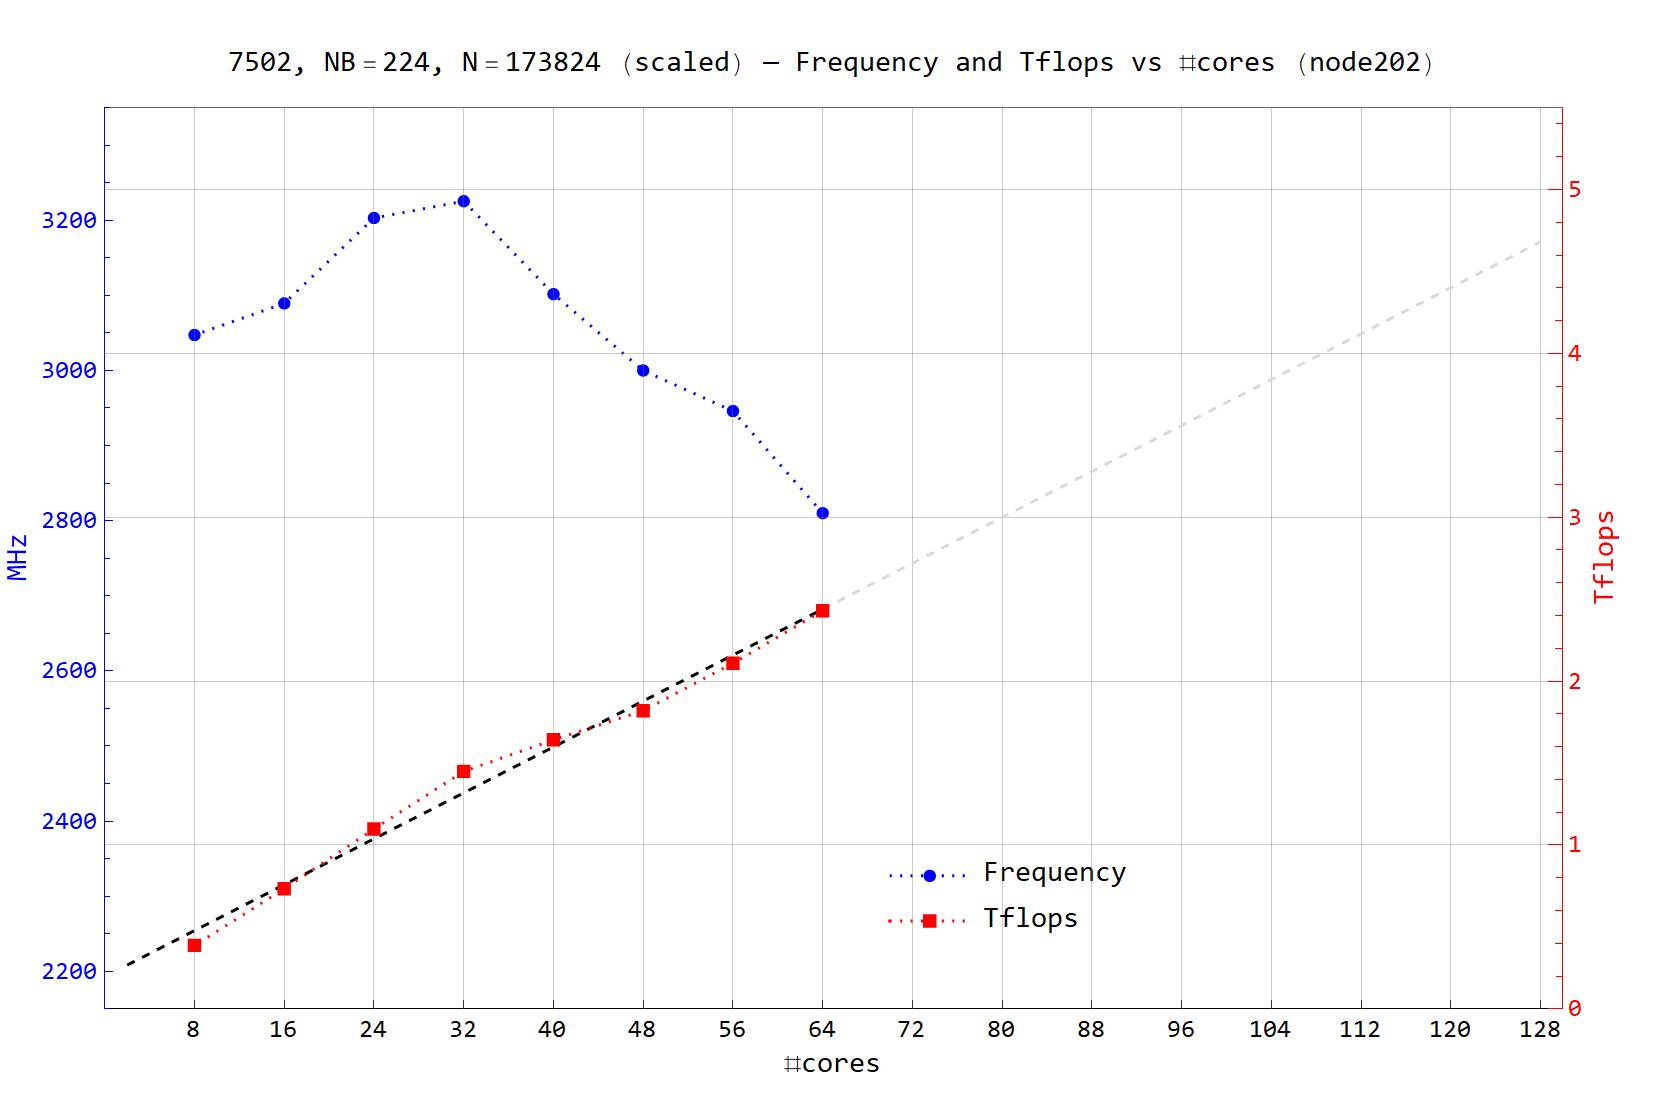
The performance drop and the kink point at 64 cores can be clearly seen in the following figures.
N = 82816 to N = 351680.NB = 128 and NB = 224.c03n[01-11]c04n[01-06]node202node206c03n[01-11]c04n[01-06]Fysikum's compute nodes have the following options modified when compared to the default R6525 BIOS settings: (1) hyperthreading disabled, (2) NUMA nodes per socket set to 4, and (3) InfiniBand card configured as a PCI preferred device.
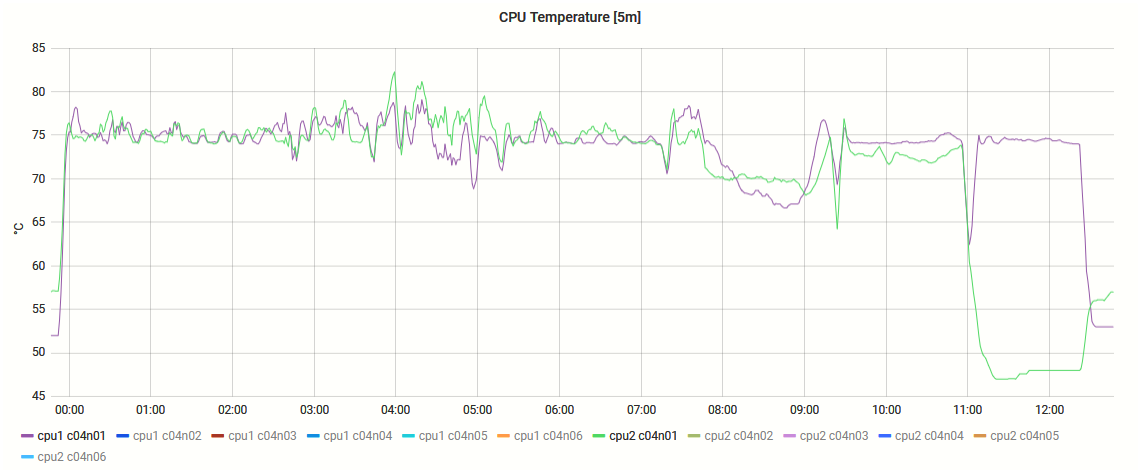
During the tests, the CPU temperature was ~75 degC. After setting System.ThermalSettings.FanSpeedOffset = Max (which forced the PWM of the fans to 100%), the average CPU temperature dropped down to 65 degC, as shown in the following figure. Nevertheless, cooling down of CPUs only slightly increased the observed performance (~1%).
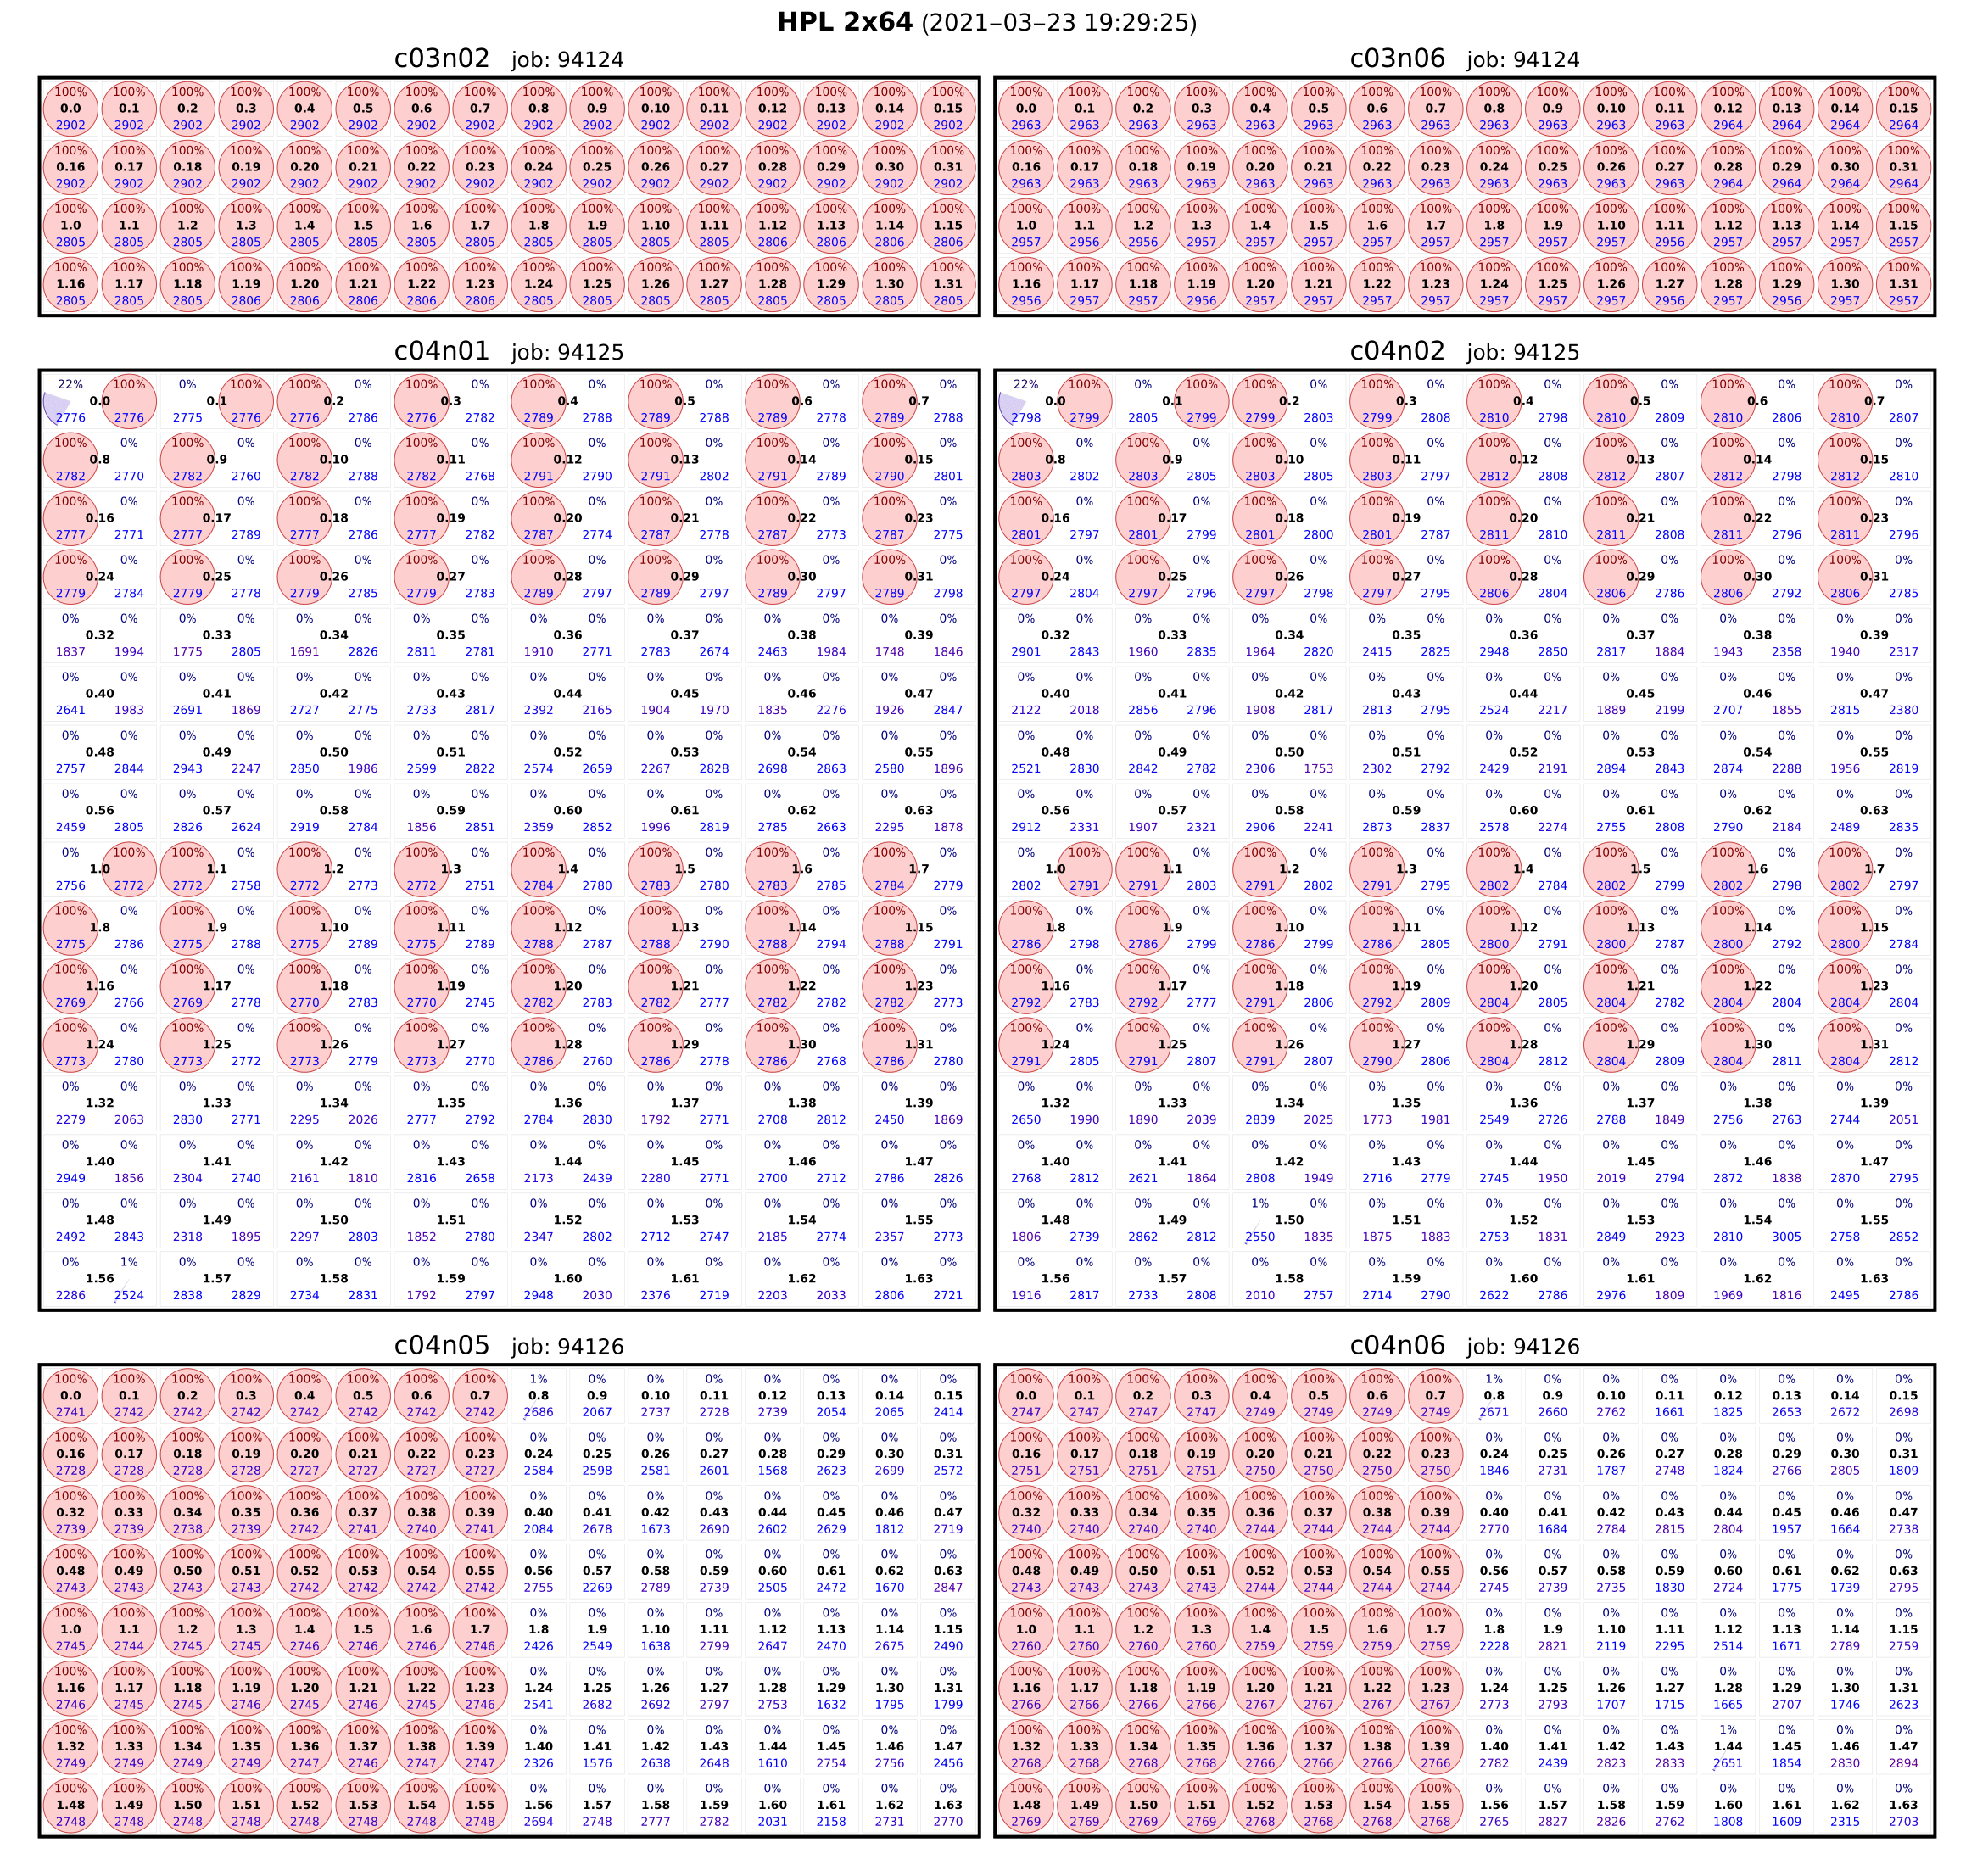
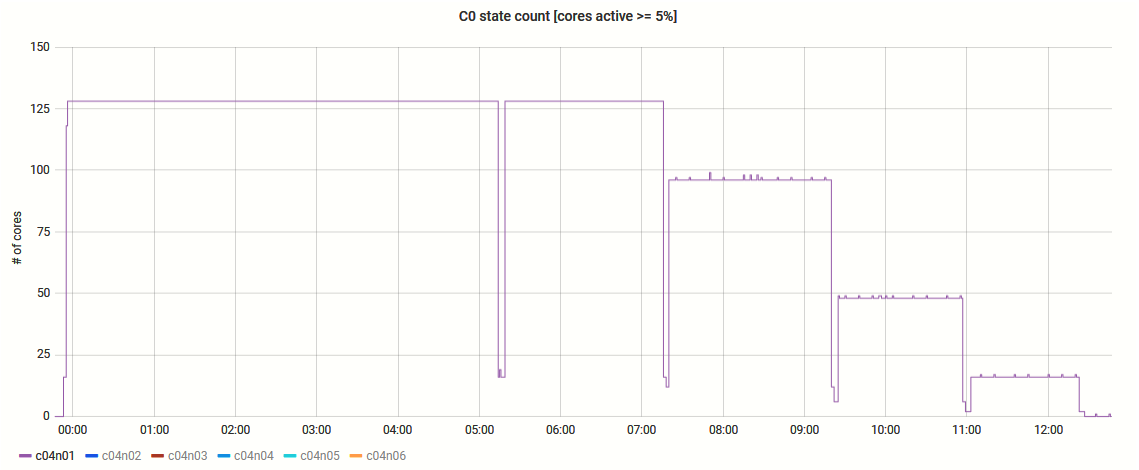
The following figures show the thermal, power, frequency and performance profiles of some typical tests withoug max cooling (i.e., at 75 degC) when using 128, 96, 48 and 16 cores.
Major tests:
Miscellaneous tests:
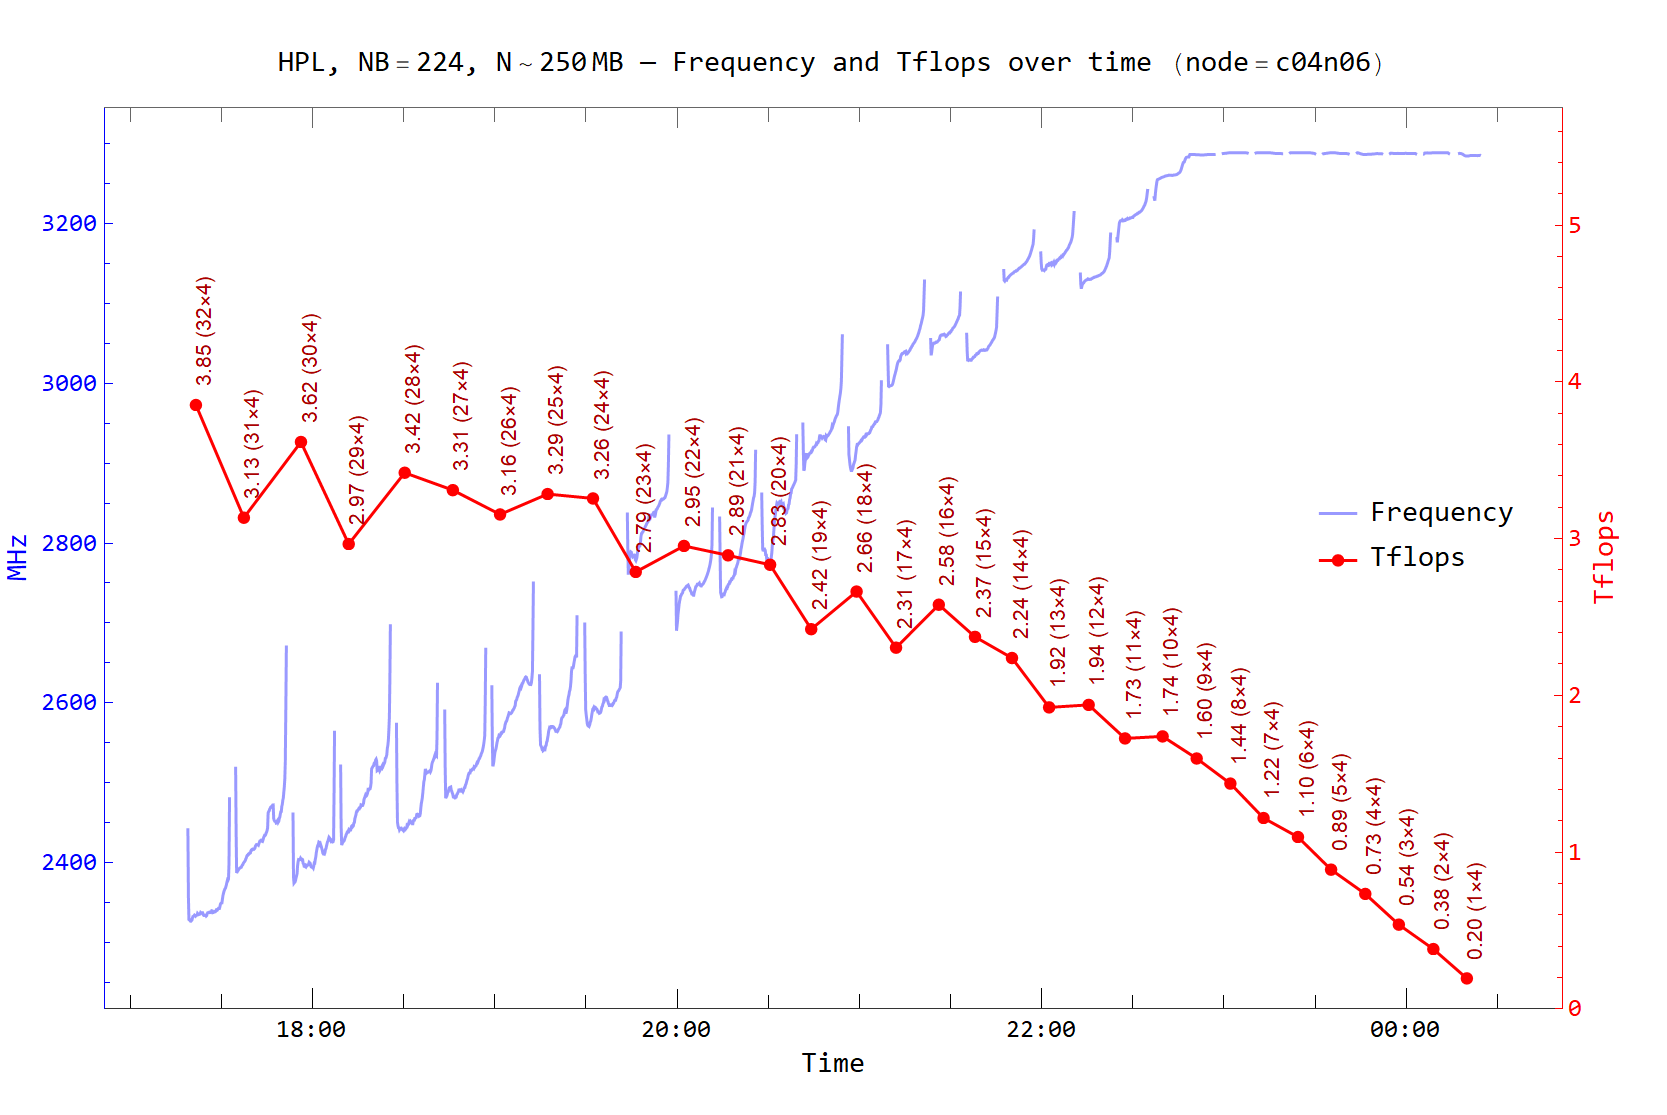
Note: c04n[01-04] had the hyperthreading enabled in the following figures.


Note: c04n[01-04] had the hyperthreading enabled in the following figures.